
UNITED STATES
SECURITIES AND EXCHANGE COMMISSION
Washington, DC 20549
FORM 8-K
CURRENT REPORT
Pursuant to Section 13 OR 15(d) of
The Securities Exchange Act of 1934
October 16, 2008
Date of Report (Date of earliest event reported)
CAPITAL ONE FINANCIAL CORPORATION
(Exact name of registrant as specified in its chapter)
| Delaware | 1-13300 | 54-1719854 | ||
| (State or other jurisdiction of incorporation) |
(Commission File Number) |
(IRS Employer Identification No.) |
| 1680 Capital One Drive, McLean, Virginia |
22102 | |
| (Address of principal executive offices) | (Zip Code) |
Registrant’s telephone number, including area code: (703) 720-1000
(Former name or former address, if changed since last report)
Check the appropriate box below if the Form 8-K filing is intended to simultaneously satisfy the filing obligation of the registrant under any of the following provisions (see General Instruction A.2. below):
| ¨ | Written communications pursuant to Rule 425 under the Securities Act (17 CFR 230.425) |
| ¨ | Soliciting material pursuant to Rule 14a-12 under the Exchange Act (17 CFR 240.14a-12) |
| ¨ | Pre-commencement communications pursuant to Rule 14d-2(b) under the Exchange Act (17 CFR 240.14d-2(b)) |
| ¨ | Pre-commencement communications pursuant to Rule 13e-4(c) under the Exchange Act (17 CFR 240.13e-4(c)) |
| Item 2.02. | Results of Operations and Financial Condition |
On October 16, 2008, the Company issued a press release announcing its financial results for the third quarter ended September 30, 2008. A copy of the Company’s press release is attached and filed herewith as Exhibit 99.1 to this Form 8-K and is incorporated herein by reference.
The Company’s consolidated financial statements prepared in accordance with generally accepted accounting principles (“GAAP”) are referred to as its “reported” financial statements. Loans included in securitization transactions which qualified as sales under GAAP have been removed from the Company’s “reported” balance sheet. However, servicing fees, finance charges, and other fees, net of charge-offs, and interest paid to investors of securitizations are recognized as servicing and securitizations income on the “reported” income statement.
The Company’s “managed” consolidated financial statements reflect adjustments made related to effects of securitization transactions qualifying as sales under GAAP. The Company generates earnings from its “managed” loan portfolio which includes both the on-balance sheet loans and off-balance sheet loans. The Company’s “managed” income statement takes the components of the servicing and securitizations income generated from the securitized portfolio and distributes the revenue and expense to appropriate income statement line items from which it originated. For this reason the Company believes the “managed” consolidated financial statements and related managed metrics to be useful to stakeholders.
| Item 7.01. | Regulation FD Disclosure. |
The Company hereby furnishes the information in Exhibit 99.2 hereto, Third Quarter Earnings Presentation for the quarter ended September 30, 2008.
Note: Information in Exhibit 99.2 furnished pursuant to Item 7.01 shall not be deemed to be “filed” for the purposes of Section 18 of the Securities Exchange Act of 1934 or otherwise subject to the liabilities of that section. This report will not be deemed an admission as to the materiality of any information in the report that is required to be disclosed solely by Regulation FD. Furthermore, the information provided in Exhibit 99.2 shall not be deemed to be incorporated by reference into the filings of the Company under the Securities Act of 1933.
2
| Item 8.01. | Other Events. |
| (a) | See attached press release, at Exhibit 99.1. |
| (b) | Cautionary Factors. |
The attached press release and information provided pursuant to Items 2.02, 7.01 and 9.01 contain forward-looking statements, which involve a number of risks and uncertainties. The Company cautions readers that any forward-looking information is not a guarantee of future performance and that actual results could differ materially from those contained in the forward-looking information as a result of various factors including, but not limited to, the following:
| • | general economic and business conditions in the U.S., the UK, or the Company’s local markets, including conditions affecting employment levels, interest rates, consumer income and confidence, spending and savings that may affect consumer bankruptcies, defaults, charge-offs, and deposit activity; |
| • | an increase or decrease in credit losses (including increases due to a worsening of general economic conditions in the credit environment); |
| • | competition from providers of products and services that compete with the Company’s businesses; |
| • | the risk that the benefits of the Company’s cost savings initiative may not be fully realized; |
| • | increases or decreases in interest rates; |
| • | the success of the Company’s marketing efforts in attracting and retaining customers; |
| • | the ability of the Company to continue to securitize its credit cards and consumer loans and to otherwise access the capital markets at attractive rates and terms to capitalize and fund its operations and future growth; |
| • | financial, legal, regulatory, tax or accounting changes or actions, including with respect to any litigation matter involving the Company; |
| • | with respect to financial and other products, increases or decreases in the Company’s aggregate loan balances and/or number of customers and the growth rate and composition thereof, including increases or decreases resulting from factors such as shifting product mix, amount of actual marketing expenses made by the Company and attrition of loan balances; |
| • | the amount and rate of deposit growth; |
| • | changes in the reputation of or expectations regarding the financial services industry and/or the Company with respect to practices, products or financial condition; |
| • | any significant disruption in the Company’s operations or technology platform; |
| • | the Company’s ability to maintain a compliance infrastructure suitable for its size and complexity; |
| • | the amount of, and rate of growth in, the Company’s expenses as the Company’s business develops or changes or as it expands into new market areas; |
| • | the ability of the Company to build the operational and organizational infrastructure necessary to engage in new businesses; |
| • | the Company’s ability to execute on its strategic and operational plans; |
| • | any significant disruption of, or loss of public confidence in, the United States Mail service affecting our response rates and consumer payments; |
| • | the ability of the Company to recruit and retain experienced personnel to assist in the management and operations of new products and services; |
| • | the risk that the cost savings and any other synergies from the Company’s acquisitions may not be fully realized or may take longer to realize than expected; |
| • | disruption from the acquisitions negatively impacting the Company’s ability to maintain relationships with customers, employees or suppliers; and |
| • | other risk factors listed from time to time in the Company’s SEC reports including, but not limited to, the Annual Report on Form 10-K for the year ended December 31, 2007, the Quarterly Reports on Form 10-Q for the quarters ended March 31, 2008 and June 30, 2008 and the Current Report on Form 8-K filed September 24, 2008. |
3
| Item 9.01. | Financial Statements, Pro Forma Financial Information and Exhibits. |
| (c) | Exhibits. |
| Exhibit No. |
Description of Exhibit | |
| 99.1 | Press release, dated October 16, 2008. | |
| 99.2 | Third Quarter Earnings Presentation. |
Earnings Conference Call Webcast Information.
Capital One will hold an earnings conference call on October 16, 2008, 5:00 PM Eastern time. The conference call will be accessible through live webcast. Interested investors and other interested individuals can access the webcast via Capital One’s home page (http://www.capitalone.com). Choose “Investors” to access the Investor Center and view and/or download the earnings press release, a reconciliation to GAAP financial measures and other relevant financial information. The replay of the webcast will be archived on Capital One’s website through December 31, 2008.
4
SIGNATURE
Pursuant to the requirements of the Securities Exchange Act of 1934, the Company has duly caused this Current Report on Form 8-K to be signed on its behalf by the undersigned, hereunto duly authorized.
| CAPITAL ONE FINANCIAL CORPORATION | ||||
| Dated: October 16, 2008 | By: | /s/ GARY L. PERLIN | ||
| Gary L. Perlin Chief Financial Officer | ||||
5
Exhibit 99.1
CAPITAL ONE FINANCIAL CORPORATION (COF)
FINANCIAL & STATISTICAL SUMMARY
REPORTED BASIS
| 2008 | 2008 | 2008 | 2007 | 2007 | ||||||||||||||||
| (in millions, except per share data and as noted) |
Q3 | Q2 | Q1 | Q4 | Q3 | |||||||||||||||
| Earnings (Reported Basis) |
||||||||||||||||||||
| Net Interest Income |
$ | 1,806.6 | $ | 1,727.8 | $ | 1,811.9 | $ | 1,762.3 | $ | 1,624.5 | ||||||||||
| Non-Interest Income |
1,696.9 | (2) | 1,622.3 | (2),(10) | 2,056.5 | (2),(7),(8) | 2,158.3 | (6) | 2,149.7 | |||||||||||
| Total Revenue (1) |
3,503.5 | 3,350.1 | 3,868.4 | 3,920.6 | 3,774.2 | |||||||||||||||
| Provision for Loan Losses |
1,093.9 | 829.1 | 1,079.1 | 1,294.2 | 595.5 | |||||||||||||||
| Marketing Expenses |
267.4 | 288.1 | 297.8 | 358.2 | 332.7 | |||||||||||||||
| Restructuring Expenses |
15.3 | 13.6 | 52.8 | 27.8 | 19.4 | |||||||||||||||
| Operating Expenses (3) |
1,527.5 | 1,517.9 | 1,471.7 | (4) | 1,749.2 | (4) | 1,582.2 | |||||||||||||
| Income Before Taxes |
599.4 | 701.4 | 967.0 | 491.2 | 1,244.4 | |||||||||||||||
| Tax Rate |
35.6 | % | 34.1 | % | 34.6 | % | 34.5 | % | 34.4 | % | ||||||||||
| Income From Continuing Operations, Net of |
$ | 385.8 | $ | 462.5 | $ | 632.6 | $ | 321.6 | $ | 816.4 | ||||||||||
| Loss From Discontinued Operations, Net of |
(11.7 | ) | (9.6 | ) | (84.1 | ) (9) | (95.0 | ) | (898.0 | ) | ||||||||||
| Net Income (Loss) |
$ | 374.1 | $ | 452.9 | $ | 548.5 | $ | 226.6 | $ | (81.6 | ) | |||||||||
| Common Share Statistics |
||||||||||||||||||||
| Basic EPS: |
||||||||||||||||||||
| Income From Continuing Operations |
$ | 1.03 | $ | 1.24 | $ | 1.71 | $ | 0.85 | $ | 2.11 | ||||||||||
| Loss From Discontinued Operations |
$ | (0.03 | ) | $ | (0.03 | ) | $ | (0.23 | ) | $ | (0.25 | ) | $ | (2.32 | ) | |||||
| Net Income (Loss) |
$ | 1.00 | $ | 1.21 | $ | 1.48 | $ | 0.60 | $ | (0.21 | ) | |||||||||
| Diluted EPS: |
||||||||||||||||||||
| Income From Continuing Operations |
$ | 1.03 | $ | 1.24 | $ | 1.70 | $ | 0.85 | $ | 2.09 | ||||||||||
| Loss From Discontinued Operations |
$ | (0.03 | ) | $ | (0.03 | ) | $ | (0.23 | ) | $ | (0.25 | ) | $ | (2.30 | ) | |||||
| Net Income (Loss) |
$ | 1.00 | $ | 1.21 | $ | 1.47 | $ | 0.60 | $ | (0.21 | ) | |||||||||
| Dividends Per Share |
$ | 0.375 | $ | 0.375 | $ | 0.375 | $ | 0.03 | $ | 0.03 | ||||||||||
| Tangible Book Value Per Share (period end) |
$ | 31.63 | $ | 30.77 | $ | 29.94 | $ | 29.00 | $ | 28.88 | ||||||||||
| Stock Price Per Share (period end) |
$ | 51.00 | $ | 38.01 | $ | 49.22 | $ | 47.26 | $ | 66.43 | ||||||||||
| Total Market Capitalization (period end) |
$ | 19,833.9 | $ | 14,280.4 | $ | 18,442.7 | $ | 17,623.3 | $ | 25,602.1 | ||||||||||
| Shares Outstanding (period end) |
388.9 | 375.7 | 374.7 | 372.9 | 385.4 | |||||||||||||||
| Shares Used to Compute Basic EPS |
372.9 | 372.3 | 370.7 | 375.6 | 386.1 | |||||||||||||||
| Shares Used to Compute Diluted EPS |
374.3 | 373.7 | 372.3 | 378.4 | 390.8 | |||||||||||||||
| Reported Balance Sheet Statistics (period average) (A) |
||||||||||||||||||||
| Average Loans Held for Investment |
$ | 98,778 | $ | 97,950 | $ | 99,819 | $ | 97,785 | $ | 91,745 | ||||||||||
| Average Earning Assets |
$ | 133,277 | $ | 131,629 | $ | 127,820 | $ | 127,242 | $ | 118,354 | ||||||||||
| Average Assets |
$ | 156,958 | $ | 154,288 | $ | 149,460 | $ | 150,926 | $ | 143,291 | ||||||||||
| Average Interest Bearing Deposits |
$ | 84,655 | $ | 78,675 | $ | 74,167 | $ | 72,074 | $ | 73,338 | ||||||||||
| Total Average Deposits |
$ | 95,328 | $ | 89,522 | $ | 84,779 | $ | 83,813 | $ | 84,667 | ||||||||||
| Average Equity |
$ | 25,046 | $ | 24,839 | $ | 24,569 | $ | 24,733 | $ | 25,344 | ||||||||||
| Return on Average Assets (ROA) |
0.98 | % | 1.20 | % | 1.69 | % | 0.85 | % | 2.28 | % | ||||||||||
| Return on Average Equity (ROE) |
6.16 | % | 7.45 | % | 10.30 | % | 5.20 | % | 12.89 | % | ||||||||||
| Reported Balance Sheet Statistics (period |
||||||||||||||||||||
| Loans Held for Investment |
$ | 97,965 | $ | 97,065 | $ | 98,356 | $ | 101,805 | $ | 93,789 | ||||||||||
| Total Assets |
$ | 154,783 | $ | 150,978 | $ | 150,428 | $ | 150,202 | $ | 143,884 | ||||||||||
| Interest Bearing Deposits |
$ | 88,248 | $ | 81,655 | $ | 76,624 | $ | 71,715 | $ | 72,285 | ||||||||||
| Total Deposits |
$ | 98,913 | $ | 92,407 | $ | 87,695 | $ | 82,761 | $ | 83,125 | ||||||||||
| Performance Statistics (Reported) (A) |
||||||||||||||||||||
| Net Interest Income Growth (annualized) |
18 | % | (19 | )% | 11 | % | 34 | % | 22 | % | ||||||||||
| Non Interest Income Growth (annualized) |
18 | % | (84 | )% | (19 | )% | 2 | % | 36 | % | ||||||||||
| Revenue Growth (annualized) |
18 | % | (54 | )% | (5 | )% | 16 | % | 30 | % | ||||||||||
| Net Interest Margin |
5.42 | % | 5.25 | % | 5.67 | % | 5.54 | % | 5.49 | % | ||||||||||
| Revenue Margin |
10.51 | % | 10.18 | % | 12.11 | % | 12.32 | % | 12.76 | % | ||||||||||
| Risk Adjusted Margin (B) |
7.90 | % | 7.77 | % | 9.71 | % | 10.28 | % | 11.13 | % | ||||||||||
| Non Interest Expense as a % of Average Loans Held for Investment (annualized) |
7.33 | % | 7.43 | % | 7.30 | % | 8.73 | % | 8.43 | % | ||||||||||
| Efficiency Ratio (C) |
51.23 | % | 53.91 | % | 45.74 | % | 53.75 | % | 50.74 | % | ||||||||||
| Asset Quality Statistics (Reported) (A) |
||||||||||||||||||||
| Allowance |
$ | 3,520 | $ | 3,311 | $ | 3,273 | $ | 2,963 | $ | 2,237 | ||||||||||
| Allowance as a % of Reported Loans Held for Investment |
3.59 | % | 3.41 | % | 3.33 | % | 2.91 | % | 2.39 | % | ||||||||||
| Net Charge-Offs |
$ | 872 | $ | 793 | $ | 767 | $ | 650 | $ | 480 | ||||||||||
| Net Charge-Off Rate |
3.53 | % | 3.24 | % | 3.07 | % | 2.66 | % | 2.09 | % | ||||||||||
| Full-time equivalent employees (in thousands) |
23.5 | 24.0 | 25.4 | 27.0 | 27.5 | |||||||||||||||
1
CAPITAL ONE FINANCIAL CORPORATION (COF)
FINANCIAL & STATISTICAL SUMMARY
MANAGED BASIS (*)
| (in millions) |
2008 Q3 |
2008 Q2 |
2008 Q1 |
2007 Q4 |
2007 Q3 |
|||||||||||||||
| Earnings (Managed Basis) |
||||||||||||||||||||
| Net Interest Income |
$ | 2,889.3 | $ | 2,788.0 | $ | 2,976.8 | $ | 3,000.5 | $ | 2,803.4 | ||||||||||
| Non-Interest Income |
1,325.6 | (2) | 1,302.0 | (2),(10) | 1,606.7 | (2),(7),(8) | 1,566.2 | (6) | 1,518.0 | |||||||||||
| Total Revenue (1) |
4,214.9 | 4,090.0 | 4,583.5 | 4,566.7 | 4,321.4 | |||||||||||||||
| Provision for Loan Losses |
1,805.3 | 1,569.0 | 1,794.2 | 1,940.3 | 1,142.7 | |||||||||||||||
| Marketing Expenses |
267.4 | 288.1 | 297.8 | 358.2 | 332.7 | |||||||||||||||
| Restructuring Expenses |
15.3 | 13.6 | 52.8 | 27.8 | 19.4 | |||||||||||||||
| Operating Expenses (3) |
1,527.5 | 1,517.9 | 1,471.7 | (4) | 1,749.2 | (4) | 1,582.2 | |||||||||||||
| Income Before Taxes |
599.4 | 701.4 | 967.0 | 491.2 | 1,244.4 | |||||||||||||||
| Tax Rate |
35.6 | % | 34.1 | % | 34.6 | % | 34.5 | % | 34.4 | % | ||||||||||
| Income From Continuing Operations, Net of Tax |
$ | 385.8 | $ | 462.5 | $ | 632.6 | $ | 321.6 | $ | 816.4 | ||||||||||
| Loss From Discontinued Operations, Net of Tax (5) |
(11.7 | ) | (9.6 | ) | (84.1 | )(9) | (95.0 | ) | (898.0 | ) | ||||||||||
| Net Income (Loss) |
$ | 374.1 | $ | 452.9 | $ | 548.5 | $ | 226.6 | $ | (81.6 | ) | |||||||||
| Managed Balance Sheet Statistics (period average) (A) |
||||||||||||||||||||
| Average Loans Held for Investment |
$ | 147,247 | $ | 147,716 | $ | 149,719 | $ | 148,362 | $ | 143,781 | ||||||||||
| Average Earning Assets |
$ | 179,752 | $ | 179,421 | $ | 175,709 | $ | 175,652 | $ | 168,238 | ||||||||||
| Average Assets |
$ | 204,694 | $ | 203,308 | $ | 198,516 | $ | 200,658 | $ | 194,528 | ||||||||||
| Return on Average Assets (ROA) |
0.75 | % | 0.91 | % | 1.27 | % | 0.64 | % | 1.68 | % | ||||||||||
| Managed Balance Sheet Statistics (period end) (A) |
||||||||||||||||||||
| Loans Held for Investment |
$ | 147,346 | $ | 147,247 | $ | 148,037 | $ | 151,362 | $ | 144,769 | ||||||||||
| Total Assets |
$ | 203,452 | $ | 200,420 | $ | 199,362 | $ | 198,908 | $ | 194,019 | ||||||||||
| Tangible Assets (D) |
$ | 190,141 | $ | 187,059 | $ | 185,962 | $ | 185,428 | $ | 180,363 | ||||||||||
| Tangible Common Equity (E) |
$ | 12,301 | $ | 11,560 | $ | 11,220 | $ | 10,814 | $ | 11,131 | ||||||||||
| Tangible Common Equity to Tangible Assets Ratio |
6.47 | %(11) | 6.18 | % | 6.03 | % | 5.83 | % | 6.17 | % | ||||||||||
| % Off-Balance Sheet Securitizations |
34 | % | 34 | % | 34 | % | 33 | % | 35 | % | ||||||||||
| Performance Statistics (Managed) (A) |
||||||||||||||||||||
| Net Interest Income Growth (annualized) |
15 | % | (25 | )% | (3 | )% | 28 | % | 29 | % | ||||||||||
| Non Interest Income Growth (annualized) |
7 | % | (76 | )% | 10 | % | 13 | % | 38 | % | ||||||||||
| Revenue Growth (annualized) |
12 | % | (43 | )% | 1 | % | 23 | % | 32 | % | ||||||||||
| Net Interest Margin |
6.43 | % | 6.22 | % | 6.78 | % | 6.83 | % | 6.67 | % | ||||||||||
| Revenue Margin |
9.38 | % | 9.12 | % | 10.43 | % | 10.40 | % | 10.27 | % | ||||||||||
| Risk Adjusted Margin (B) |
5.86 | % | 5.70 | % | 7.06 | % | 7.45 | % | 7.83 | % | ||||||||||
| Non Interest Expense as a % of Average Loans Held for Investment (annualized) |
4.92 | % | 4.93 | % | 4.87 | % | 5.76 | % | 5.38 | % | ||||||||||
| Efficiency Ratio (C) |
42.58 | % | 44.16 | % | 38.61 | % | 46.15 | % | 44.31 | % | ||||||||||
| Asset Quality Statistics (Managed) (A) |
||||||||||||||||||||
| Net Charge-Offs |
$ | 1,583 | $ | 1,533 | $ | 1,482 | $ | 1,296 | $ | 1,027 | ||||||||||
| Net Charge-Off Rate |
4.30 | % | 4.15 | % | 3.96 | % | 3.49 | % | 2.86 | % | ||||||||||
| (*) | The information in this statistical summary reflects the adjustment to add back the effect of securitization transactions qualifying as sales under generally accepted accounting principles. See accompanying schedule—“Reconciliation to GAAP Financial Measures”. |
2
CAPITAL ONE FINANCIAL CORPORATION (COF)
FINANCIAL & STATISTICAL SUMMARY NOTES
| (1) | In accordance with the Company’s finance charge and fee revenue recognition policy, the amounts billed to customers but not recognized as revenue were as follows: Q3 2008—$445.7 million, Q2 2008—$476.0 million, Q1 2008—$407.6 million, Q4 2007—$379.4 million, and Q3 2007—$310.5 million. |
| (2) | The Company recorded a decrease to its interest-only strips of $66.7 million in Q3 2008 and $71.0 million in Q2 2008. In Q1 2008 the Company recorded an increase of $42.8 million to its interest-only strips. |
| (3) | Includes core deposit intangible amortization expense of $47.3 million in Q3 2008, $48.5 million in Q2 2008, $49.8 million in Q1 2008, $51.1 million in Q4 2007 and $52.4 million in Q3 2007 and integration costs of $10.3 million in Q3 2008, $27.4 million in Q2 2008, $28.9 million in Q1 2008, $28.6 million in Q4 2007 and $30.3 million in Q3 2007. |
| (4) | In Q4 2007, the Company recognized a pre-tax charge of approximately $140 million for liabilities in connection with the Visa antitrust lawsuit settlement with American Express and estimated possible damages in connection with other pending Visa litigation. In Q1 2008, the Company, in connection with the Visa initial public offering (IPO), reversed approximately $91 million of these legal liabilities. |
| (5) | In Q3 2007, the Company shutdown the mortgage origination operations of its wholesale mortgage banking unit, GreenPoint Mortgage, realizing an after tax loss of $898.0 million. The results of the mortgage origination operation of GreenPoint have been accounted for as a discontinued operation and have been removed from the Company’s results of continuing operations for all periods presented. The results of GreenPoint’s mortgage servicing business are reported in continuing operations for all periods presented. Effective Q4 2007, GreenPoint’s held for investment commercial and consumer loan portfolio results are included in continuing operations. |
| (6) | During the fourth quarter 2007, the Company completed the sale of its interest in a relationship agreement to develop and market consumer credit products in the Spanish Market and recorded a gain related to this sale of approximately $30 million in non-interest income. |
| (7) | In Q1 2008 the Company recorded a gain of $109.0 million in non-interest income from the redemption of 2.5 million shares related to the Visa IPO. |
| (8) | In Q1 2008 the Company repurchased approximately $1.0 billion of certain senior unsecured debt, recognizing a gain of $52.0 million in non-interest income. The Company initiated the repurchases to take advantage of the current rate environment and replaced the borrowings with lower-rate unsecured funding. |
| (9) | In Q1 2008 the Company recorded a pre-tax expense of $104.2 million in discontinued operations to cover expected future claims made under representations and warranties provided by the Company on loans previously sold to third parties by GreenPoint’s mortgage origination operation. See also note (5) above. |
| (10) | In Q2 2008 the Company elected to convert and sell 154,991 shares of MasterCard class B common stock. The Company recognized gains of $44.9 million in non-interest income from this transaction. |
| (11) | The Q3 2008 TCE ratio reflects the issuance of 15,527,000 shares on September 30, 2008 at $49 per share. |
STATISTICS / METRIC DEFINITIONS
| (A) | Based on continuing operations. Average equity and return on equity are based on the Company’s stockholders’ equity. |
| (B) | Risk adjusted margin equals total revenue less net charge-offs as a percentage of average earning assets. |
| (C) | Efficiency ratio equals non-interest expense less restructuring expense divided by total revenue. |
| (D) | Tangible assets include managed assets less intangible assets. |
| (E) | Includes stockholders’ equity and preferred interests less intangible assets and related deferred tax liabilities. Tangible Common Equity on a reported and managed basis is the same. |
3
CAPITAL ONE FINANCIAL CORPORATION (COF)
SEGMENT FINANCIAL & STATISTICAL SUMMARY FOR CONTINUING OPERATIONS
MANAGED BASIS (1)
| 2008 | 2008 | 2008 | 2007 | 2007 | ||||||||||||||||
| (in thousands) |
Q3 | Q2 | Q1 | Q4 (6) | Q3 (6) | |||||||||||||||
| Local Banking: |
||||||||||||||||||||
| Interest Income |
$ | 1,519,217 | $ | 1,489,612 | $ | 1,575,325 | $ | 1,707,377 | $ | 1,751,898 | ||||||||||
| Interest Expense |
895,481 | 899,907 | 1,008,371 | 1,122,841 | 1,165,594 | |||||||||||||||
| Net interest income |
$ | 623,736 | $ | 589,705 | $ | 566,954 | $ | 584,536 | $ | 586,304 | ||||||||||
| Non-interest income |
215,701 | 192,758 | 215,469 | 206,002 | 232,662 | |||||||||||||||
| Provision for loan losses |
81,052 | 92,043 | 60,394 | 42,665 | (58,192 | ) | ||||||||||||||
| Other non-interest expenses |
622,697 | 587,211 | 605,351 | 589,943 | 577,309 | |||||||||||||||
| Income tax provision |
47,491 | 36,123 | 40,837 | 54,328 | 104,353 | |||||||||||||||
| Net income |
$ | 88,197 | $ | 67,086 | $ | 75,841 | $ | 103,602 | $ | 195,496 | ||||||||||
| Loans Held for Investment |
$ | 44,662,818 | $ | 44,270,734 | $ | 44,197,085 | $ | 43,972,795 | $ | 42,233,665 | ||||||||||
| Average Loans Held for Investment |
$ | 44,319,475 | $ | 44,250,451 | $ | 43,887,387 | $ | 43,128,767 | $ | 41,992,618 | ||||||||||
| Core Deposits (2) |
$ | 64,386,336 | $ | 63,407,571 | $ | 62,811,696 | $ | 62,977,637 | $ | 62,494,588 | ||||||||||
| Total Deposits |
$ | 75,045,812 | $ | 74,245,677 | $ | 73,387,227 | $ | 73,089,284 | $ | 72,795,566 | ||||||||||
| Loans Held for Investment Yield |
6.25 | % | 6.35 | % | 6.75 | % | 7.02 | % | 7.13 | % | ||||||||||
| Net Interest Margin—Loans (3) |
1.98 | % | 1.99 | % | 1.92 | % | 1.87 | % | 1.79 | % | ||||||||||
| Net Interest Margin—Deposits (4) |
2.18 | % | 2.04 | % | 1.93 | % | 2.05 | % | 2.09 | % | ||||||||||
| Efficiency Ratio (5) |
74.18 | % | 75.05 | % | 77.37 | % | 74.63 | % | 70.49 | % | ||||||||||
| Net charge-off rate |
0.46 | % | 0.34 | % | 0.31 | % | 0.29 | % | 0.20 | % | ||||||||||
| Non Performing Loans |
$ | 430,211 | $ | 359,017 | $ | 249,055 | $ | 178,385 | $ | 112,794 | ||||||||||
| Foreclosed Assets |
41,290 | 29,607 | 24,790 | 14,058 | 14,083 | |||||||||||||||
| Non Performing Assets (9) |
$ | 471,501 | $ | 388,624 | $ | 273,845 | $ | 192,443 | $ | 126,877 | ||||||||||
| Non Performing Loans as a % of Loans Held for Investment |
0.96 | % | 0.81 | % | 0.56 | % | 0.41 | % | 0.27 | % | ||||||||||
| Non Performing Asset Rate (9) |
1.05 | % | 0.88 | % | 0.62 | % | 0.44 | % | 0.30 | % | ||||||||||
| Non-Interest Expenses as a % of Average Loans Held for Investment |
5.62 | % | 5.31 | % | 5.52 | % | 5.47 | % | 5.50 | % | ||||||||||
| Number of Active ATMs |
1,310 | 1,303 | 1,297 | 1,288 | 1,282 | |||||||||||||||
| Number of Locations |
739 | 740 | 745 | 742 | 732 | |||||||||||||||
| National Lending (8): |
||||||||||||||||||||
| Interest Income |
$ | 3,251,446 | $ | 3,181,773 | $ | 3,530,017 | $ | 3,670,404 | $ | 3,504,019 | ||||||||||
| Interest Expense |
1,019,911 | 1,014,244 | 1,121,434 | 1,231,978 | 1,228,280 | |||||||||||||||
| Net interest income |
$ | 2,231,535 | $ | 2,167,529 | $ | 2,408,583 | $ | 2,438,426 | $ | 2,275,739 | ||||||||||
| Non-interest income |
1,195,622 | 1,164,810 | 1,226,114 | 1,370,655 | 1,274,688 | |||||||||||||||
| Provision for loan losses |
1,678,513 | 1,470,642 | 1,677,220 | 1,777,327 | 1,195,995 | |||||||||||||||
| Other non-interest expenses |
1,176,396 | 1,236,567 | 1,279,171 | 1,361,709 | 1,333,688 | |||||||||||||||
| Income tax provision |
200,626 | 217,496 | 236,203 | 229,084 | 350,277 | |||||||||||||||
| Net income |
$ | 371,622 | $ | 407,634 | $ | 442,103 | $ | 440,961 | $ | 670,467 | ||||||||||
| Loans Held for Investment |
$ | 101,922,850 | $ | 102,201,802 | $ | 103,003,402 | $ | 106,508,443 | $ | 102,556,271 | ||||||||||
| Average Loans Held for Investment |
$ | 102,142,752 | $ | 102,629,246 | $ | 104,973,633 | $ | 104,321,485 | $ | 101,805,584 | ||||||||||
| Core Deposits (2) |
$ | 2,171 | $ | 1,954 | $ | 2,171 | $ | 1,599 | $ | 470 | ||||||||||
| Total Deposits |
$ | 1,650,507 | $ | 1,644,241 | $ | 1,774,690 | $ | 2,050,861 | $ | 2,295,131 | ||||||||||
| Loans Held for Investment Yield |
12.73 | % | 12.40 | % | 13.45 | % | 14.07 | % | 13.77 | % | ||||||||||
| Net Interest Margin |
8.74 | % | 8.45 | % | 9.18 | % | 9.35 | % | 8.94 | % | ||||||||||
| Revenue Margin |
13.42 | % | 12.99 | % | 13.85 | % | 14.61 | % | 13.95 | % | ||||||||||
| Risk Adjusted Margin |
7.57 | % | 7.31 | % | 8.51 | % | 9.88 | % | 9.99 | % | ||||||||||
| Non-Interest Expenses as a % of Average Loans Held for Investment |
4.61 | % | 4.82 | % | 4.87 | % | 5.22 | % | 5.24 | % | ||||||||||
| Efficiency Ratio (5) |
34.33 | % | 37.11 | % | 35.19 | % | 35.75 | % | 37.56 | % | ||||||||||
| Net charge-off rate |
5.85 | % | 5.67 | % | 5.34 | % | 4.73 | % | 3.96 | % | ||||||||||
| Delinquency Rate (30+ days) |
5.43 | % | 4.87 | % | 4.73 | % | 5.17 | % | 4.70 | % | ||||||||||
| Number of Loan Accounts (000s) |
45,314 | 45,812 | 48,065 | 48,537 | 48,473 | |||||||||||||||
| Other: |
||||||||||||||||||||
| Net interest income |
$ | 34,060 | $ | 30,761 | $ | 1,313 | $ | (22,449 | ) | $ | (58,605 | ) | ||||||||
| Non-interest income |
(85,764 | ) | (55,594 | ) | 165,102 | (10,425 | ) | 10,639 | ||||||||||||
| Provision for loan losses |
45,705 | 6,342 | 56,598 | 120,376 | 5,022 | |||||||||||||||
| Restructuring expenses |
15,345 | 13,560 | 52,759 | 27,809 | 19,354 | |||||||||||||||
| Other non-interest expenses |
(4,230 | ) | (17,737 | ) | (115,004 | ) | 155,746 | 3,870 | ||||||||||||
| Income tax provision (benefit) |
(34,494 | ) | (14,776 | ) | 57,451 | (113,854 | ) | (26,620 | ) | |||||||||||
| Net income (loss) |
$ | (74,030 | ) | $ | (12,222 | ) | $ | 114,611 | $ | (222,951 | ) | $ | (49,592 | ) | ||||||
| Loans Held for Investment |
$ | 760,078 | $ | 774,724 | $ | 836,041 | $ | 881,179 | $ | (21,375 | ) | |||||||||
| Core Deposits (2) |
$ | 20,800,890 | $ | 14,800,701 | $ | 10,729,004 | $ | 6,107,779 | $ | 6,373,515 | ||||||||||
| Total Deposits |
$ | 22,216,655 | $ | 16,517,143 | $ | 12,533,025 | $ | 7,621,031 | $ | 8,034,332 | ||||||||||
| Total: |
||||||||||||||||||||
| Interest Income |
$ | 4,346,262 | $ | 4,270,572 | $ | 4,628,257 | $ | 4,863,246 | $ | 4,646,431 | ||||||||||
| Interest Expense |
1,456,931 | 1,482,577 | 1,651,407 | 1,862,733 | 1,842,993 | |||||||||||||||
| Net interest income |
$ | 2,889,331 | $ | 2,787,995 | $ | 2,976,850 | $ | 3,000,513 | $ | 2,803,438 | ||||||||||
| Non-interest income |
1,325,559 | 1,301,974 | 1,606,685 | 1,566,232 | 1,517,989 | |||||||||||||||
| Provision for loan losses |
1,805,270 | 1,569,027 | 1,794,212 | 1,940,368 | 1,142,825 | |||||||||||||||
| Restructuring expenses |
15,345 | 13,560 | 52,759 | 27,809 | 19,354 | |||||||||||||||
| Other non-interest expenses |
1,794,863 | 1,806,041 | 1,769,518 | 2,107,398 | 1,914,867 | |||||||||||||||
| Income tax provision |
213,623 | 238,843 | 334,491 | 169,558 | 428,010 | |||||||||||||||
| Net income |
$ | 385,789 | $ | 462,498 | $ | 632,555 | $ | 321,612 | $ | 816,371 | ||||||||||
| Loans Held for Investment |
$ | 147,345,746 | $ | 147,247,260 | $ | 148,036,528 | $ | 151,362,417 | $ | 144,768,561 | ||||||||||
| Core Deposits (2) |
$ | 85,189,397 | $ | 78,210,226 | $ | 73,542,871 | $ | 69,087,015 | $ | 68,868,573 | ||||||||||
| Total Deposits |
$ | 98,912,974 | $ | 92,407,061 | $ | 87,694,942 | $ | 82,761,176 | $ | 83,125,029 | ||||||||||
4
CAPITAL ONE FINANCIAL CORPORATION (COF)
LOCAL BANKING SEGMENT FINANCIAL & STATISTICAL INFORMATION
| (in thousands) |
2008 Q3 |
2008 Q2 |
2008 Q1 |
2007 Q4 |
2007 Q3 |
|||||||||||||||
| Loans Held for Investment: |
||||||||||||||||||||
| Commercial Lending |
||||||||||||||||||||
| Commercial and Multi-Family Real Estate |
$ | 13,043,369 | $ | 12,948,037 | $ | 12,655,900 | $ | 12,414,263 | $ | 11,961,400 | ||||||||||
| Middle Market |
9,768,420 | 8,923,233 | 8,695,171 | 8,288,476 | 7,544,926 | |||||||||||||||
| Small Ticket Commercial Real Estate |
2,695,570 | 2,746,931 | 2,840,594 | 2,948,402 | 2,335,012 | |||||||||||||||
| Specialty Lending |
3,634,212 | 3,693,532 | 3,546,200 | 3,396,100 | 3,019,100 | |||||||||||||||
| Total Commercial Lending |
$ | 29,141,571 | $ | 28,311,733 | $ | 27,737,865 | $ | 27,047,241 | $ | 24,860,438 | ||||||||||
| Small Business Lending |
$ | 4,580,299 | $ | 4,555,432 | $ | 4,588,500 | $ | 4,612,500 | $ | 4,612,400 | ||||||||||
| Consumer Lending |
||||||||||||||||||||
| Mortgages |
$ | 7,402,290 | $ | 7,803,032 | $ | 8,214,624 | $ | 8,513,216 | $ | 8,902,468 | ||||||||||
| Branch Based Home Equity & Other Consumer |
3,782,342 | 3,887,936 | 3,938,849 | 4,095,228 | 4,075,828 | |||||||||||||||
| Total Consumer Lending |
$ | 11,184,632 | $ | 11,690,968 | $ | 12,153,473 | $ | 12,608,444 | $ | 12,978,296 | ||||||||||
| Other |
$ | (243,684 | ) | $ | (287,399 | ) | $ | (282,753 | ) | $ | (295,390 | ) | $ | (217,469 | ) | |||||
| Total Loans Held for Investment |
$ | 44,662,818 | $ | 44,270,734 | $ | 44,197,085 | $ | 43,972,795 | $ | 42,233,665 | ||||||||||
| Non Performing Asset Rates(9): |
||||||||||||||||||||
| Commercial Lending |
||||||||||||||||||||
| Commercial and Multi-Family Real Estate |
1.06 | % | 0.87 | % | 0.46 | % | 0.24 | % | 0.08 | % | ||||||||||
| Middle Market |
0.26 | % | 0.31 | % | 0.42 | % | 0.41 | % | 0.29 | % | ||||||||||
| Small Ticket Commercial Real Estate |
4.49 | % | 2.74 | % | 1.62 | % | 0.54 | % | 0.27 | % | ||||||||||
| Specialty Lending |
0.38 | % | 0.25 | % | 0.18 | % | 0.18 | % | 0.19 | % | ||||||||||
| Total Commercial Lending |
1.03 | % | 0.79 | % | 0.53 | % | 0.32 | % | 0.17 | % | ||||||||||
| Small Business Lending |
1.14 | % | 1.17 | % | 1.00 | % | 1.06 | % | 0.93 | % | ||||||||||
| Consumer Lending |
||||||||||||||||||||
| Mortgages |
1.41 | % | 1.22 | % | 0.81 | % | 0.54 | % | 0.35 | % | ||||||||||
| Branch Based Home Equity & Other Consumer |
0.40 | % | 0.39 | % | 0.35 | % | 0.30 | % | 0.25 | % | ||||||||||
| Total Consumer Lending |
1.07 | % | 0.95 | % | 0.66 | % | 0.46 | % | 0.32 | % | ||||||||||
| Total Non Performing Asset Rate |
1.05 | % | 0.88 | % | 0.62 | % | 0.44 | % | 0.30 | % | ||||||||||
| Net Charge Off Rates: |
||||||||||||||||||||
| Commercial Lending |
||||||||||||||||||||
| Commercial and Multi-Family Real Estate |
0.14 | % | 0.10 | % | 0.02 | % | 0.02 | % | 0.00 | % | ||||||||||
| Middle Market |
0.15 | % | 0.05 | % | 0.15 | % | 0.12 | % | (0.04 | )% | ||||||||||
| Small Ticket Commercial Real Estate |
0.10 | % | (0.03 | )% | 0.30 | % | 0.21 | % | 0.35 | % | ||||||||||
| Specialty Lending |
0.26 | % | 0.16 | % | 0.05 | % | 0.15 | % | 0.14 | % | ||||||||||
| Total Commercial Lending |
0.16 | % | 0.08 | % | 0.09 | % | 0.09 | % | 0.04 | % | ||||||||||
| Small Business Lending |
1.17 | % | 0.91 | % | 0.97 | % | 0.63 | % | 0.47 | % | ||||||||||
| Consumer Lending |
||||||||||||||||||||
| Mortgages |
0.50 | % | 0.35 | % | 0.11 | % | 0.19 | % | 0.08 | % | ||||||||||
| Branch Based Home Equity & Other Consumer |
1.01 | % | 1.02 | % | 1.21 | % | 1.04 | % | 0.79 | % | ||||||||||
| Total Consumer Lending |
0.67 | % | 0.57 | % | 0.46 | % | 0.46 | % | 0.31 | % | ||||||||||
| Total Net Charge Off Rate |
0.46 | % | 0.34 | % | 0.31 | % | 0.29 | % | 0.20 | % | ||||||||||
5
CAPITAL ONE FINANCIAL CORPORATION (COF)
NATIONAL LENDING SUBSEGMENT FINANCIAL & STATISTICAL SUMMARY FOR CONTINUING OPERATIONS
MANAGED BASIS (1), (8)
| 2008 | 2008 | 2008 | 2007 | 2007 | ||||||||||||||||
| (in thousands) |
Q3 | Q2 | Q1 | Q4 (6) | Q3 (6) | |||||||||||||||
| US Card: |
||||||||||||||||||||
| Interest Income |
$ | 2,240,896 | $ | 2,132,284 | $ | 2,433,665 | $ | 2,548,929 | $ | 2,418,890 | ||||||||||
| Interest Expense |
624,858 | 608,655 | 689,951 | 780,985 | 798,493 | |||||||||||||||
| Net interest income |
$ | 1,616,038 | $ | 1,523,629 | $ | 1,743,714 | $ | 1,767,944 | $ | 1,620,397 | ||||||||||
| Non-interest income |
1,027,918 | 1,010,177 | 1,070,831 | 1,163,795 | 1,107,801 | |||||||||||||||
| Provision for loan losses |
1,240,580 | 1,099,453 | 1,120,025 | 1,195,469 | 807,318 | |||||||||||||||
| Non-interest expenses |
872,588 | 910,619 | 938,860 | 976,118 | 965,351 | |||||||||||||||
| Income tax provision |
185,775 | 183,307 | 264,481 | 261,492 | 328,702 | |||||||||||||||
| Net income |
$ | 345,013 | $ | 340,427 | $ | 491,179 | $ | 498,660 | $ | 626,827 | ||||||||||
| Loans Held for Investment |
$ | 69,361,743 | $ | 68,059,998 | $ | 67,382,004 | $ | 69,723,169 | $ | 66,687,232 | ||||||||||
| Average Loans Held for Investment |
$ | 68,581,983 | $ | 67,762,384 | $ | 68,544,190 | $ | 67,727,632 | $ | 66,472,124 | ||||||||||
| Loans Held for Investment Yield |
13.07 | % | 12.59 | % | 14.20 | % | 15.05 | % | 14.56 | % | ||||||||||
| Net Interest Margin |
9.43 | % | 8.99 | % | 10.18 | % | 10.44 | % | 9.75 | % | ||||||||||
| Revenue Margin |
15.42 | % | 14.96 | % | 16.42 | % | 17.31 | % | 16.42 | % | ||||||||||
| Risk Adjusted Margin |
9.29 | % | 8.70 | % | 10.58 | % | 12.47 | % | 12.56 | % | ||||||||||
| Non-Interest Expenses as a % of Average Loans Held for Investment |
5.09 | % | 5.38 | % | 5.48 | % | 5.76 | % | 5.81 | % | ||||||||||
| Efficiency Ratio (5) |
33.00 | % | 35.94 | % | 33.36 | % | 33.29 | % | 35.38 | % | ||||||||||
| Net charge-off rate |
6.13 | % | 6.26 | % | 5.85 | % | 4.84 | % | 3.85 | % | ||||||||||
| Delinquency Rate (30+ days) |
4.20 | % | 3.85 | % | 4.04 | % | 4.28 | % | 3.80 | % | ||||||||||
| Purchase Volume (7) |
$ | 26,536,070 | $ | 26,738,213 | $ | 24,543,082 | $ | 28,230,725 | $ | 26,628,978 | ||||||||||
| Number of Loan Accounts (000s) |
37,916 | 38,415 | 40,611 | 41,044 | 41,081 | |||||||||||||||
| Auto Finance: |
||||||||||||||||||||
| Interest Income |
$ | 635,305 | $ | 666,499 | $ | 690,919 | $ | 687,389 | $ | 661,471 | ||||||||||
| Interest Expense |
265,804 | 276,911 | 289,357 | 300,133 | 283,949 | |||||||||||||||
| Net interest income |
$ | 369,501 | $ | 389,588 | $ | 401,562 | $ | 387,256 | $ | 377,522 | ||||||||||
| Non-interest income |
14,607 | 15,672 | 16,110 | 14,888 | 13,514 | |||||||||||||||
| Provision for loan losses |
244,078 | 230,614 | 408,251 | 429,247 | 244,537 | |||||||||||||||
| Non-interest expenses |
117,677 | 123,021 | 136,169 | 144,301 | 152,275 | |||||||||||||||
| Income tax (benefit) provision |
7,824 | 18,069 | (44,362 | ) | (58,963 | ) | (1,987 | ) | ||||||||||||
| Net (loss) income |
$ | 14,529 | $ | 33,556 | $ | (82,386 | ) | $ | (112,441 | ) | $ | (3,789 | ) | |||||||
| Loans Held for Investment |
$ | 22,306,394 | $ | 23,401,160 | $ | 24,633,665 | $ | 25,128,352 | $ | 24,335,242 | ||||||||||
| Average Loans Held for Investment |
$ | 22,857,540 | $ | 24,098,881 | $ | 25,047,501 | $ | 24,920,380 | $ | 24,170,047 | ||||||||||
| Loans Held for Investment Yield |
11.12 | % | 11.06 | % | 11.03 | % | 11.03 | % | 10.95 | % | ||||||||||
| Net Interest Margin |
6.47 | % | 6.47 | % | 6.41 | % | 6.22 | % | 6.25 | % | ||||||||||
| Revenue Margin |
6.72 | % | 6.73 | % | 6.67 | % | 6.45 | % | 6.47 | % | ||||||||||
| Risk Adjusted Margin |
1.73 | % | 2.88 | % | 2.69 | % | 2.46 | % | 2.91 | % | ||||||||||
| Non-Interest Expenses as a % of Average Loans Held for Investment |
2.06 | % | 2.04 | % | 2.17 | % | 2.32 | % | 2.52 | % | ||||||||||
| Efficiency Ratio (5) |
30.64 | % | 30.36 | % | 32.60 | % | 35.88 | % | 38.94 | % | ||||||||||
| Net charge-off rate |
5.00 | % | 3.84 | % | 3.98 | % | 4.00 | % | 3.56 | % | ||||||||||
| Delinquency Rate (30+ days) |
9.32 | % | 7.62 | % | 6.42 | % | 7.84 | % | 7.15 | % | ||||||||||
| Auto Loan Originations |
$ | 1,444,291 | $ | 1,513,686 | $ | 2,440,227 | $ | 3,623,491 | $ | 3,248,747 | ||||||||||
| Number of Loan Accounts (000s) |
1,665 | 1,710 | 1,763 | 1,771 | 1,731 | |||||||||||||||
| International: |
||||||||||||||||||||
| Interest Income |
$ | 375,245 | $ | 382,990 | $ | 405,433 | $ | 434,086 | $ | 423,658 | ||||||||||
| Interest Expense |
129,249 | 128,678 | 142,126 | 150,860 | 145,838 | |||||||||||||||
| Net interest income |
$ | 245,996 | $ | 254,312 | $ | 263,307 | $ | 283,226 | $ | 277,820 | ||||||||||
| Non-interest income |
153,097 | 138,961 | 139,173 | 191,972 | 153,373 | |||||||||||||||
| Provision for loan losses |
193,855 | 140,575 | 148,944 | 152,611 | 144,140 | |||||||||||||||
| Non-interest expenses |
186,131 | 202,927 | 204,142 | 241,290 | 216,062 | |||||||||||||||
| Income tax provision |
7,027 | 16,120 | 16,084 | 26,555 | 23,562 | |||||||||||||||
| Net income |
$ | 12,080 | $ | 33,651 | $ | 33,310 | $ | 54,742 | $ | 47,429 | ||||||||||
| Loans Held for Investment |
$ | 10,254,713 | $ | 10,740,644 | $ | 10,987,733 | $ | 11,656,922 | $ | 11,533,797 | ||||||||||
| Average Loans Held for Investment |
$ | 10,703,229 | $ | 10,767,981 | $ | 11,381,942 | $ | 11,673,473 | $ | 11,163,413 | ||||||||||
| Loans Held for Investment Yield |
14.02 | % | 14.23 | % | 14.25 | % | 14.87 | % | 15.18 | % | ||||||||||
| Net Interest Margin |
9.19 | % | 9.45 | % | 9.25 | % | 9.70 | % | 9.95 | % | ||||||||||
| Revenue Margin |
14.91 | % | 14.61 | % | 14.14 | % | 16.28 | % | 15.45 | % | ||||||||||
| Risk Adjusted Margin |
9.01 | % | 8.54 | % | 8.84 | % | 10.67 | % | 10.00 | % | ||||||||||
| Non-Interest Expenses as a % of Average Loans Held for Investment |
6.96 | % | 7.54 | % | 7.17 | % | 8.27 | % | 7.74 | % | ||||||||||
| Efficiency Ratio (5) |
46.64 | % | 51.60 | % | 50.72 | % | 50.78 | % | 50.11 | % | ||||||||||
| Net charge-off rate |
5.90 | % | 6.07 | % | 5.30 | % | 5.61 | % | 5.45 | % | ||||||||||
| Delinquency Rate (30+ days) |
5.24 | % | 5.35 | % | 5.12 | % | 4.79 | % | 4.69 | % | ||||||||||
| Purchase Volume (7) |
$ | 2,857,975 | $ | 2,879,223 | $ | 2,716,060 | $ | 2,966,350 | $ | 2,369,696 | ||||||||||
| Number of Loan Accounts (000s) |
5,733 | 5,687 | 5,691 | 5,722 | 5,661 | |||||||||||||||
6
CAPITAL ONE FINANCIAL CORPORATION (COF)
SEGMENT AND NATIONAL LENDING SUBSEGMENT
FINANCIAL & STATISTICAL SUMMARY FOR CONTINUING OPERATIONS NOTES
| (1) | The information in this statistical summary reflects the adjustment to add back the effect of securitization transactions qualifying as sales under generally accepted accounting principles. See accompanying schedule—“Reconciliation to GAAP Financial Measures.” In Q3 2007, the Company shutdown the mortgage origination operations of its wholesale mortgage banking unit, GreenPoint Mortgage. The results of the mortgage origination operation of GreenPoint have been accounted for as a discontinued operation and have been removed from the Company’s results of continuing operations for all periods presented. The results of GreenPoint’s mortgage servicing business are reported in continuing operations for all periods presented. Effective Q4 2007, GreenPoint’s held for investment commercial and consumer loan portfolio results are included in continuing operations. |
| (2) | Includes domestic non-interest bearing deposits, NOW accounts, money market deposit accounts, savings accounts, certificates of deposit of less than $100,000 and other consumer time deposits. |
| (3) | Net Interest Margin—Loans equals net interest income earned on loans divided by average managed loans. |
| (4) | Net Interest Margin—Deposits equals net interest income earned on deposits divided by average deposits. |
| (5) | Efficiency Ratio equals non-interest expenses divided by total managed revenue. |
| (6) | Certain prior period amounts have been reclassified to conform with current period presentation. |
| (7) | Includes all purchase transactions net of returns and excludes cash advance transactions. |
| (8) | In Q1 2008 the Company reorganized its National Lending subsegments from U.S. Card, Auto Finance and Global Financial Services to U.S. Card and Other National Lending. The U.S. Card subsegment contains the results of the Company’s domestic credit card business, small business lending and the installment loan business. The Other National Lending subsegment contains the results of the Company’s auto finance business and the Company’s international lending businesses. Components of the Other National Lending subsegment are separately disclosed. Segment and subsegment results have been restated for all periods presented. |
| (9) | Non performing assets is comprised of non performing loans and forclosed assets. The non performing asset rate equals non performing assets divided by the sum of loans held for investment plus foreclosed assets. |
7
CAPITAL ONE FINANCIAL CORPORATION
Reconciliation to GAAP Financial Measures
For the Three Months Ended September 30, 2008
(dollars in thousands)(unaudited)
The Company’s consolidated financial statements prepared in accordance with generally accepted accounting principles (“GAAP”) are referred to as its “reported” financial statements. Loans included in securitization transactions which qualified as sales under GAAP have been removed from the Company’s “reported” balance sheet. However, servicing fees, finance charges, and other fees, net of charge-offs, and interest paid to investors of securitizations are recognized as servicing and securitizations income on the “reported” income statement.
The Company’s “managed” consolidated financial statements reflect adjustments made related to effects of securitization transactions qualifying as sales under GAAP. The Company generates earnings from its “managed” loan portfolio which includes both the on-balance sheet loans and off-balance sheet loans. The Company’s “managed” income statement takes the components of the servicing and securitizations income generated from the securitized portfolio and distributes the revenue and expense to appropriate income statement line items from which it originated. For this reason the Company believes the “managed” consolidated financial statements and related managed metrics to be useful to stakeholders.
| Total Reported | Adjustments (1) | Total Managed (2) | ||||||||
| Income Statement Measures (3) |
||||||||||
| Net interest income |
$ | 1,806,645 | $ | 1,082,685 | $ | 2,889,330 | ||||
| Non-interest income |
1,696,891 | (371,332 | ) | 1,325,559 | ||||||
| Total revenue |
3,503,536 | 711,353 | 4,214,889 | |||||||
| Provision for loan and lease losses |
1,093,917 | 711,353 | 1,805,270 | |||||||
| Net charge-offs |
$ | 872,077 | $ | 711,353 | $ | 1,583,430 | ||||
| Balance Sheet Measures |
||||||||||
| Loans held for investment |
$ | 97,965,351 | $ | 49,380,395 | $ | 147,345,746 | ||||
| Total assets |
$ | 154,803,113 | $ | 48,668,878 | $ | 203,471,991 | ||||
| Average loans held for investment |
$ | 98,778,393 | $ | 48,469,005 | $ | 147,247,398 | ||||
| Average earning assets |
$ | 133,314,755 | $ | 46,475,814 | $ | 179,790,569 | ||||
| Average total assets |
$ | 156,997,954 | $ | 47,735,935 | $ | 204,733,889 | ||||
| Delinquencies |
$ | 3,768,339 | $ | 2,106,140 | $ | 5,874,479 | ||||
| (1) | Income statement adjustments reclassify the net of finance charges of $1,369.0 million, past-due fees of $240.8 million, other interest income of $(35.3) million and interest expense of $491.8 million; and net charge-offs of $711.4 million from non-interest income to net interest income and provision for loan and lease losses, respectively. |
| (2) | The managed loan portfolio does not include auto loans which have been sold in whole loan sale transactions where the Company has retained servicing rights. |
| (3) | Based on continuing operations. |
8
CAPITAL ONE FINANCIAL CORPORATION
Consolidated Balance Sheets
(in thousands)(unaudited)
| As of Sept 30 2008 |
As of June 30 2008 |
As of Sept 30 2007 |
||||||||||
| Assets: |
||||||||||||
| Cash and due from banks |
$ | 3,511,558 | $ | 2,280,244 | $ | 1,819,121 | ||||||
| Federal funds sold and resale agreements |
1,435,521 | 1,526,799 | 1,922,735 | |||||||||
| Interest-bearing deposits at other banks |
673,662 | 717,572 | 703,805 | |||||||||
| Cash and cash equivalents |
5,620,741 | 4,524,615 | 4,445,661 | |||||||||
| Securities available for sale |
26,969,471 | 25,028,853 | 19,959,247 | |||||||||
| Mortgage loans held for sale |
98,900 | 111,824 | 1,454,457 | |||||||||
| Loans held for investment |
97,965,351 | 97,065,238 | 95,405,217 | |||||||||
| Less: Allowance for loan and lease losses |
(3,519,610 | ) | (3,311,003 | ) | (2,320,000 | ) | ||||||
| Net loans held for investment |
94,445,741 | 93,754,235 | 93,085,217 | |||||||||
| Accounts receivable from securitizations |
4,980,823 | 5,301,906 | 6,905,859 | |||||||||
| Premises and equipment, net |
2,305,286 | 2,321,487 | 2,268,034 | |||||||||
| Interest receivable |
750,717 | 778,595 | 793,693 | |||||||||
| Goodwill |
12,815,642 | 12,826,738 | 12,952,838 | |||||||||
| Other |
6,815,792 | 6,466,018 | 5,289,829 | |||||||||
| Total assets |
$ | 154,803,113 | $ | 151,114,271 | $ | 147,154,835 | ||||||
| Liabilities: |
||||||||||||
| Non-interest-bearing deposits |
$ | 10,665,286 | $ | 10,752,059 | $ | 10,840,189 | ||||||
| Interest-bearing deposits |
88,247,688 | 81,655,001 | 72,284,840 | |||||||||
| Senior and subordinated notes |
8,278,856 | 8,506,339 | 10,784,182 | |||||||||
| Other borrowings |
15,962,072 | 19,302,185 | 22,940,304 | |||||||||
| Interest payable |
508,091 | 621,489 | 552,674 | |||||||||
| Other |
5,529,580 | 5,355,733 | 4,965,794 | |||||||||
| Total liabilities |
129,191,573 | 126,192,806 | 122,367,983 | |||||||||
| Stockholders’ Equity: |
||||||||||||
| Common stock |
4,383 | 4,223 | 4,183 | |||||||||
| Paid-in capital, net |
16,752,078 | 15,966,810 | 15,768,525 | |||||||||
| Retained earnings and cumulative other comprehensive income |
12,020,490 | 12,115,480 | 11,395,226 | |||||||||
| Less: Treasury stock, at cost |
(3,165,411 | ) | (3,165,048 | ) | (2,381,082 | ) | ||||||
| Total stockholders’ equity |
25,611,540 | 24,921,465 | 24,786,852 | |||||||||
| Total liabilities and stockholders’ equity |
$ | 154,803,113 | $ | 151,114,271 | $ | 147,154,835 | ||||||
9
CAPITAL ONE FINANCIAL CORPORATION
Consolidated Statements of Income
(in thousands, except per share data)(unaudited)
| Three Months Ended | Nine Months Ended | |||||||||||||||||||
| Sept 30 2008 |
June 30 2008 |
Sept 30 2007 |
Sept 30 2008 |
Sept 30 2007 |
||||||||||||||||
| Interest Income: |
||||||||||||||||||||
| Loans held for investment, including past-due fees |
$ | 2,347,480 | $ | 2,297,709 | $ | 2,381,096 | $ | 7,153,582 | $ | 6,963,349 | ||||||||||
| Securities available for sale |
317,274 | 281,089 | 252,550 | 856,110 | 694,608 | |||||||||||||||
| Other |
107,042 | 113,059 | 133,321 | 333,486 | 460,005 | |||||||||||||||
| Total interest income |
2,771,796 | 2,691,857 | 2,766,967 | 8,343,178 | 8,117,962 | |||||||||||||||
| Interest Expense: |
||||||||||||||||||||
| Deposits |
624,319 | 592,576 | 740,091 | 1,827,284 | 2,220,177 | |||||||||||||||
| Senior and subordinated notes |
96,568 | 114,797 | 144,643 | 352,335 | 417,250 | |||||||||||||||
| Other borrowings |
244,264 | 256,728 | 257,759 | 817,241 | 712,937 | |||||||||||||||
| Total interest expense |
965,151 | 964,101 | 1,142,493 | 2,996,860 | 3,350,364 | |||||||||||||||
| Net interest income |
1,806,645 | 1,727,756 | 1,624,474 | 5,346,318 | 4,767,598 | |||||||||||||||
| Provision for loan and lease losses |
1,093,917 | 829,130 | 595,534 | 3,002,119 | 1,342,292 | |||||||||||||||
| Net interest income after provision for loan and lease losses |
712,728 | 898,626 | 1,028,940 | 2,344,199 | 3,425,306 | |||||||||||||||
| Non-Interest Income: |
||||||||||||||||||||
| Servicing and securitizations |
875,718 | 834,740 | 1,354,303 | 2,793,520 | 3,569,281 | |||||||||||||||
| Service charges and other customer-related fees |
576,762 | 524,209 | 522,374 | 1,675,032 | 1,484,820 | |||||||||||||||
| Mortgage servicing and other |
39,183 | 16,552 | 52,661 | 90,990 | 172,476 | |||||||||||||||
| Interchange |
148,076 | 132,730 | 103,799 | 432,708 | 347,889 | |||||||||||||||
| Other |
57,152 | 114,085 | 116,525 | 383,435 | 321,417 | |||||||||||||||
| Total non-interest income |
1,696,891 | 1,622,316 | 2,149,662 | 5,375,685 | 5,895,883 | |||||||||||||||
| Non-Interest Expense: |
||||||||||||||||||||
| Salaries and associate benefits |
571,686 | 578,572 | 627,358 | 1,761,538 | 1,970,433 | |||||||||||||||
| Marketing |
267,372 | 288,100 | 332,693 | 853,265 | 989,654 | |||||||||||||||
| Communications and data processing |
176,720 | 195,102 | 194,551 | 559,065 | 569,405 | |||||||||||||||
| Supplies and equipment |
126,781 | 131,937 | 134,639 | 389,649 | 384,971 | |||||||||||||||
| Occupancy |
96,483 | 80,137 | 77,597 | 264,700 | 230,835 | |||||||||||||||
| Restructuring expense |
15,306 | 13,560 | 19,354 | 81,625 | 110,428 | |||||||||||||||
| Other |
555,858 | 532,193 | 548,029 | 1,542,242 | 1,687,077 | |||||||||||||||
| Total non-interest expense |
1,810,206 | 1,819,601 | 1,934,221 | 5,452,084 | 5,942,803 | |||||||||||||||
| Income from continuing operations before income taxes |
599,413 | 701,341 | 1,244,381 | 2,267,800 | 3,378,386 | |||||||||||||||
| Income taxes |
213,624 | 238,843 | 428,010 | 786,958 | 1,108,279 | |||||||||||||||
| Income from continuing operations, net of tax |
385,789 | 462,498 | 816,371 | 1,480,842 | 2,270,107 | |||||||||||||||
| Loss from discontinued operations, net of tax (1) |
(11,650 | ) | (9,593 | ) | (898,029 | ) | (105,294 | ) | (926,343 | ) | ||||||||||
| Net income |
$ | 374,139 | $ | 452,905 | $ | (81,658 | ) | $ | 1,375,548 | $ | 1,343,764 | |||||||||
| Basic earnings per share |
||||||||||||||||||||
| Income from continuing operations |
$ | 1.03 | $ | 1.24 | $ | 2.11 | $ | 3.98 | $ | 5.74 | ||||||||||
| Loss from discontinued operations |
(0.03 | ) | (0.03 | ) | (2.32 | ) | (0.28 | ) | (2.34 | ) | ||||||||||
| Net income |
$ | 1.00 | $ | 1.21 | $ | (0.21 | ) | $ | 3.70 | $ | 3.40 | |||||||||
| Diluted earnings per share |
||||||||||||||||||||
| Income from continuing operations |
$ | 1.03 | $ | 1.24 | $ | 2.09 | $ | 3.96 | $ | 5.66 | ||||||||||
| Loss from discontinued operations |
(0.03 | ) | (0.03 | ) | (2.30 | ) | (0.28 | ) | (2.31 | ) | ||||||||||
| Net income |
$ | 1.00 | $ | 1.21 | $ | (0.21 | ) | $ | 3.68 | $ | 3.35 | |||||||||
| Dividends paid per share |
$ | 0.375 | $ | 0.375 | $ | 0.03 | $ | 1.125 | $ | 0.08 | ||||||||||
| (1) | In Q3 2007, the Company shutdown the mortgage origination operations of its wholesale mortgage banking unit, GreenPoint Mortgage. The results of the mortgage origination operation of GreenPoint have been accounted for as a discontinued operation and have been removed from the Company’s results of continuing operations for all periods presented. |
10
CAPITAL ONE FINANCIAL CORPORATION
Statements of Average Balances, Income and Expense, Yields and Rates (1)
(dollars in thousands)(unaudited)
| Reported | Quarter Ended 9/30/08 | Quarter Ended 6/30/08 (2) | Quarter Ended 9/30/07 (2) | ||||||||||||||||||||||||
| Average Balance |
Income/ Expense |
Yield/ Rate |
Average Balance |
Income/ Expense |
Yield/ Rate |
Average Balance |
Income/ Expense |
Yield/ Rate |
|||||||||||||||||||
| Earning assets: |
|||||||||||||||||||||||||||
| Loans held for investment |
$ | 98,778,393 | $ | 2,347,480 | 9.51 | % | $ | 97,949,572 | $ | 2,297,709 | 9.38 | % | 91,744,846 | 2,381,096 | 10.38 | % | |||||||||||
| Securities available for sale |
25,780,669 | 317,274 | 4.92 | % | 24,165,577 | 281,089 | 4.65 | % | 20,041,177 | 252,550 | 5.04 | % | |||||||||||||||
| Other |
8,717,921 | 107,042 | 4.91 | % | 9,513,873 | 113,059 | 4.75 | % | 6,568,358 | 133,321 | 8.12 | % | |||||||||||||||
| Total earning assets |
$ | 133,276,983 | $ | 2,771,796 | 8.32 | % | $ | 131,629,022 | $ | 2,691,857 | 8.18 | % | $ | 118,354,381 | $ | 2,766,967 | 9.35 | % | |||||||||
| Interest-bearing liabilities: |
|||||||||||||||||||||||||||
| Interest-bearing deposits |
|||||||||||||||||||||||||||
| NOW accounts |
$ | 9,292,819 | $ | 30,263 | 1.30 | % | $ | 8,769,608 | $ | 24,802 | 1.13 | % | $ | 9,192,861 | $ | 59,275 | 2.58 | % | |||||||||
| Money market deposit accounts |
26,914,607 | 187,740 | 2.79 | % | 24,881,125 | 165,871 | 2.67 | % | 24,046,304 | 269,628 | 4.49 | % | |||||||||||||||
| Savings accounts |
7,759,024 | 16,243 | 0.84 | % | 8,191,586 | 19,521 | 0.95 | % | 8,345,638 | 37,474 | 1.80 | % | |||||||||||||||
| Other consumer time deposits |
26,733,531 | 262,101 | 3.92 | % | 22,676,841 | 243,921 | 4.30 | % | 17,203,453 | 194,256 | 4.52 | % | |||||||||||||||
| Public fund CD’s of $100,000 or more |
1,305,438 | 8,233 | 2.52 | % | 1,476,155 | 10,313 | 2.79 | % | 1,884,767 | 23,092 | 4.90 | % | |||||||||||||||
| CD’s of $100,000 or more |
9,084,740 | 89,192 | 3.93 | % | 9,124,586 | 98,516 | 4.32 | % | 8,673,860 | 103,296 | 4.76 | % | |||||||||||||||
| Foreign time deposits |
3,564,449 | 30,547 | 3.43 | % | 3,555,189 | 29,632 | 3.33 | % | 3,991,056 | 53,070 | 5.32 | % | |||||||||||||||
| Total interest-bearing deposits |
$ | 84,654,608 | $ | 624,319 | 2.95 | % | $ | 78,675,090 | $ | 592,576 | 3.01 | % | $ | 73,337,939 | $ | 740,091 | 4.04 | % | |||||||||
| Senior and subordinated notes |
8,282,536 | 96,568 | 4.66 | % | 9,125,017 | 114,797 | 5.03 | % | 9,811,821 | 144,643 | 5.90 | % | |||||||||||||||
| Other borrowings |
22,368,976 | 244,264 | 4.37 | % | 24,851,821 | 256,728 | 4.13 | % | 19,110,111 | 257,759 | 5.40 | % | |||||||||||||||
| Total interest-bearing liabilities |
$ | 115,306,120 | $ | 965,151 | 3.35 | % | $ | 112,651,928 | $ | 964,101 | 3.42 | % | $ | 102,259,871 | $ | 1,142,493 | 4.47 | % | |||||||||
| Net interest spread |
4.97 | % | 4.76 | % | 4.88 | % | |||||||||||||||||||||
| Interest income to average earning assets |
8.32 | % | 8.18 | % | 9.35 | % | |||||||||||||||||||||
| Interest expense to average earning assets |
2.90 | % | 2.93 | % | 3.86 | % | |||||||||||||||||||||
| Net interest margin |
5.42 | % | 5.25 | % | 5.49 | % | |||||||||||||||||||||
| (1) | Average balances, income and expenses, yields and rates are based on continuing operations. |
| (2) | Certain prior period amounts have been reclassified to conform with current period presentation. |
11
CAPITAL ONE FINANCIAL CORPORATION
Statements of Average Balances, Income and Expense, Yields and Rates (2)
(dollars in thousands)(unaudited)
| Managed (1) | Quarter Ended 9/30/08 | Quarter Ended 6/30/08 (3) | Quarter Ended 9/30/07 (3) | ||||||||||||||||||||||||
| Average Balance |
Income/ Expense |
Yield/ Rate |
Average Balance |
Income/ Expense |
Yield/ Rate |
Average Balance |
Income/ Expense |
Yield/ Rate |
|||||||||||||||||||
| Earning assets: |
|||||||||||||||||||||||||||
| Loans held for investment |
$ | 147,247,398 | $ | 3,974,375 | 10.80 | % | $ | 147,715,693 | $ | 3,929,069 | 10.64 | % | $ | 143,781,268 | $ | 4,324,272 | 12.03 | % | |||||||||
| Securities available for sale |
25,780,669 | 317,274 | 4.92 | % | 24,165,577 | 281,089 | 4.65 | % | 20,041,177 | 252,550 | 5.04 | % | |||||||||||||||
| Other |
6,724,730 | 54,612 | 3.25 | % | 7,539,256 | 60,414 | 3.21 | % | 4,415,978 | 69,610 | 6.31 | % | |||||||||||||||
| Total earning assets |
$ | 179,752,797 | $ | 4,346,261 | 9.67 | % | $ | 179,420,526 | $ | 4,270,572 | 9.52 | % | $ | 168,238,423 | $ | 4,646,432 | 11.05 | % | |||||||||
| Interest-bearing liabilities: |
|||||||||||||||||||||||||||
| Interest-bearing deposits |
|||||||||||||||||||||||||||
| NOW accounts |
$ | 9,292,819 | $ | 30,263 | 1.30 | % | $ | 8,769,608 | $ | 24,802 | 1.13 | % | $ | 9,192,861 | $ | 59,275 | 2.58 | % | |||||||||
| Money market deposit accounts |
26,914,607 | 187,740 | 2.79 | % | 24,881,125 | 165,871 | 2.67 | % | 24,046,304 | $ | 269,628 | 4.49 | % | ||||||||||||||
| Savings accounts |
7,759,024 | 16,243 | 0.84 | % | 8,191,586 | 19,521 | 0.95 | % | 8,345,638 | $ | 37,474 | 1.80 | % | ||||||||||||||
| Other consumer time deposits |
26,733,531 | 262,101 | 3.92 | % | 22,676,841 | 243,921 | 4.30 | % | 17,203,453 | $ | 194,256 | 4.52 | % | ||||||||||||||
| Public fund CD’s of $100,000 or more |
1,305,438 | 8,233 | 2.52 | % | 1,476,155 | 10,313 | 2.79 | % | 1,884,767 | $ | 23,092 | 4.90 | % | ||||||||||||||
| CD’s of $100,000 or more |
9,084,740 | 89,192 | 3.93 | % | 9,124,586 | 98,516 | 4.32 | % | 8,673,860 | $ | 103,296 | 4.76 | % | ||||||||||||||
| Foreign time deposits |
3,564,449 | 30,547 | 3.43 | % | 3,555,189 | 29,632 | 3.33 | % | 3,991,056 | $ | 53,070 | 5.32 | % | ||||||||||||||
| Total interest-bearing deposits |
$ | 84,654,608 | $ | 624,319 | 2.95 | % | $ | 78,675,090 | $ | 592,576 | 3.01 | % | $ | 73,337,939 | $ | 740,091 | 4.04 | % | |||||||||
| Senior and subordinated notes |
8,282,536 | 96,568 | 4.66 | % | 9,125,017 | 114,797 | 5.03 | % | 9,811,821 | $ | 144,643 | 5.90 | % | ||||||||||||||
| Other borrowings |
22,368,976 | 244,264 | 4.37 | % | 24,851,821 | 256,728 | 4.13 | % | 19,110,111 | $ | 257,759 | 5.40 | % | ||||||||||||||
| Securitization liability |
48,069,177 | 491,780 | 4.09 | % | 49,317,336 | 518,477 | 4.21 | % | 51,320,446 | $ | 700,501 | 5.46 | % | ||||||||||||||
| Total interest-bearing liabilities |
$ | 163,375,297 | $ | 1,456,931 | 3.57 | % | $ | 161,969,264 | $ | 1,482,578 | 3.66 | % | $ | 153,580,317 | $ | 1,842,994 | 4.80 | % | |||||||||
| Net interest spread |
6.10 | % | 5.86 | % | 6.25 | % | |||||||||||||||||||||
| Interest income to average earning assets |
9.67 | % | 9.52 | % | 11.05 | % | |||||||||||||||||||||
| Interest expense to average earning assets |
3.24 | % | 3.30 | % | 4.38 | % | |||||||||||||||||||||
| Net interest margin |
6.43 | % | 6.22 | % | 6.67 | % | |||||||||||||||||||||
| (1) | The information in this table reflects the adjustment to add back the effect of securitized loans. |
| (2) | Average balances, income and expenses, yields and rates are based on continuing operations. |
| (3) | Certain prior period amounts have been reclassified to conform with current period presentation. |
12
 |
Press Release | |||||||
| Contacts: | ||||||||
| Investor Relations | Media Relations | |||||||
| Jeff Norris | Danielle Dietz | Tatiana Stead | Julie Rakes | |||||
| 703.720.2455 | 703.720.2455 | 703.720.2352 | 804.284.5800 | |||||
FOR IMMEDIATE RELEASE: October 16, 2008
Capital One Reports Third Quarter Earnings per Share (diluted) of $1.00
Total deposits increase $6.5 billion to $98.9 billion
Credit performance in line with expectations
McLean, Va. (October 16, 2008) – Capital One Financial Corporation (NYSE: COF) today announced earnings for the third quarter of 2008 of $374.1 million, or $1.00 per share (diluted). Earnings from continuing operations in the third quarter of 2008 were $385.8 million, or $1.03 per share. In the third quarter of 2007, the company reported a net loss of $81.6 million, or $.21 per share (diluted), and earnings from continuing operations of $816.4 million, or $2.09 per share (diluted). Earnings per share from continuing operations in the third quarter of 2008 were down $1.06 from the year ago quarter, driven primarily by higher provision expense, and down $0.21 from the second quarter of 2008 with higher revenues and lower non-interest expense being offset by higher provision expense.
Earnings from continuing operations exclude the loss from discontinued operations related to the shutdown of GreenPoint Mortgage in August 2007.
HIGHLIGHTS
| • | Credit performance in the third quarter was largely in line with prior expectations and reflects both normal seasonal trends and continued pressure from the weakening economy. |
| o | The managed charge-off rate for the company increased 15 basis points to 4.30 percent from the second quarter of 2008. The managed delinquency rate increased in the third quarter by 35 basis points from the second quarter of 2008 to 3.99 percent. |
| o | As expected, the company built its allowance for loan losses in the third quarter by $208.6 million. At $3.5 billion, this is consistent with an outlook for $7.2 billion in managed charge-offs through the end of the third quarter of 2009. |
| • | Balance sheet and diversified funding remain sources of strength in a volatile market |
| o | The company issued approximately $750 million in common stock during the quarter. Coupled with continued capital generation from its businesses, the company’s tangible common equity to tangible managed assets ratio (TCE) increased to 6.47 percent, above the high end of the company’s target range of 5.5 to 6.0 percent. |
13
| o | At the end of the third quarter, the company had readily available and committed liquidity of $32.0 billion. |
| o | Total ending deposits increased $6.5 billion to $98.9 billion. The cost of deposits declined six basis points in the quarter. |
“Against the backdrop of increasing economic headwinds and unprecedented change in the financial services landscape, Capital One continues to deliver profits and generate capital, said Richard D. Fairbank, Capital One’s Chairman and Chief Executive Officer. “But we are not complacent. Based on what we’re seeing in the world around us, we are significantly increasing the intensity of our efforts to aggressively manage the company for the benefit of investors and customers through the current downturn.”
Total Company Results
| • | Managed loans held for investment of $147.3 billion were essentially even with the second quarter of 2008, and increased from the year ago quarter by $2.6 billion, or 1.8 percent. |
| • | Total revenue increased $124.9 million, or 3.1 percent, compared to the second quarter of 2008, but declined $106.5 million, or 2.5 percent, relative to the third quarter of 2007. |
| • | Managed revenue margin of 9.38 percent in the third quarter of 2008 was up 26 basis points compared to 9.12 percent in the second quarter of 2008, but down 89 basis points from 10.27 percent in the third quarter of 2007. |
| • | Managed provision expense was $1.8 billion. The company added $208.6 million to its allowance in the third quarter of 2008. At $3.5 billion, this is consistent with an outlook for $7.2 billion in managed charge-offs through the third quarter of 2009. |
| • | Total deposits were $98.9 billion at September 30, 2008, an increase of $6.5 billion, or 7.0 percent, relative to June 30, 2008 and an increase of $15.8 billion, or 19.0 percent relative to September 30, 2007. |
| • | Operating expenses increased $9.6 million relative to the second quarter of 2008. The managed efficiency ratio for the third quarter of 2008 was 42.6 percent, down from 44.2 percent in the second quarter of 2008. The company expects full year operating expenses to be around $6.2 billion. It also expects its operating efficiency ratio to be in the mid-forty percent range or lower for the full year 2008, with seasonally higher expenses in the fourth quarter. |
“Given the volatility and strains in the financial system and global economy, we are more committed than ever to supporting our business with a rock solid balance sheet through the recession,” said Gary L. Perlin, Capital One’s Chief Financial Officer. “Our capital ratios are comfortably above our targets and
14
our readily available liquidity is more than four times our debt refinancing needs for the next year, positioning us not only to navigate this storm but also to capitalize on financially attractive opportunities when they arise.”
Segment Results
Local Banking Segment highlights
The Local Banking segment delivered solid and steady results in the third quarter. Higher revenues and lower provision expense drove the growth in profits relative to the second quarter of 2008. Deposits grew in the quarter and deposit pricing and margins improved. Charge-offs and non-performing loans increased modestly in the third quarter, consistent with the continuing deterioration in the economy. Despite these increases, the credit quality and trends in the Local Banking loan portfolio continue to outperform competitors nationally and in the banking footprint. The company expects loans to remain basically flat for the remainder of 2008, while it expects further growth in deposits.
| • | Net income of $88.2 million increased $21.1 million, or 31.5 percent, from $67.1 million in the second quarter of 2008. |
| • | Loans held for investment of $44.7 billion were up slightly relative to the second quarter of 2008. |
| • | Local Banking deposits increased $800.1 million from the second quarter of 2008 to $75.0 billion. |
| • | The net charge-off rate of 46 basis points increased from 34 basis points in the second quarter of 2008, while non-performing loans as a percent of loans held for investment of 96 basis points increased from 81 basis points in the second quarter of 2008. |
National Lending Segment
The National Lending segment contains the results of the company’s U.S. Card, Auto Finance and International lending businesses.
| • | Net income for the National Lending segment was down $36.0 million, or 8.8 percent, compared to the second quarter of 2008, and $298.8 million, or 44.6 percent, relative to the third quarter of 2007. |
| • | The managed charge-off rate for the National Lending segment increased 18 basis points to 5.85 percent in the third quarter of 2008 from 5.67 percent in the second quarter of 2008. |
| • | The delinquency rate of 5.43 percent in the third quarter of 2008 for the National Lending segment increased 56 basis points from 4.87 percent as of June 30, 2008. |
15
U.S. Card highlights
U.S. Card results in the third quarter reflect the company’s continued actions to navigate ongoing economic and cyclical headwinds. The business remains cautious on loan growth and continues to focus its marketing and originations on the parts of the U.S. Card market that the company believes provide the best combination of risk-adjusted returns and losses. Credit performance in the quarter was largely in line with expectations. The U.S. Card business remains well positioned to successfully navigate near-term challenges and to deliver solid results through the economic cycle.
| • | U.S. Card reported net income of $345.0 million, a 1.3 percent increase relative to the second quarter of 2008 but a 45.0 percent decrease relative to the third quarter of 2007. |
| • | Total revenues increased $110.2 million, or 4.3 percent, compared to the second quarter of 2008, but decreased $84.2 million, or 3.1 percent, relative to the prior year’s same quarter. |
| • | Non-interest expenses declined 4.2 percent over the previous quarter and 9.6 percent relative to the third quarter of 2007. |
| • | Managed loans increased from the second quarter of 2008 by 1.9 percent, or $1.3 billion, to $69.4 billion at September 30, 2008, and increased 4.0 percent from the year ago quarter. |
| • | Charge-offs declined in the third quarter of 2008 to 6.13 percent from 6.26 percent in the second quarter of 2008, but increased from 3.85 percent in the third quarter of 2007. The company expects the charge-off rate to rise to around seven percent for the fourth quarter, and to the mid-seven percent range for the first quarter of 2009. Delinquencies increased in the third quarter of 2008 to 4.20 percent from 3.85 percent in the previous quarter and from 3.80 percent in the year ago quarter. |
Auto Finance highlights
Auto Finance results in the quarter were driven by solid and stable revenue margin and operating efficiency, as well as a lower provision for loan losses as the overall portfolio continues to shrink as a result of the aggressive steps taken by the business to retrench and reposition the business at the beginning of 2008. Credit metrics in the short term will continue to be impacted by seasonality, the seasoning of earlier vintages and broader cyclical economic challenges.
| • | Auto Finance posted net income of $14.5 million in the third quarter, compared to $33.6 million last quarter, and a loss of $3.8 million in the third quarter of 2007. |
| • | Net charge-offs of 5.00 percent increased 116 basis points from 3.84 percent in the second quarter of 2008, while delinquencies increased 170 basis points from 7.62 percent in the second quarter of 2008 to 9.32 percent. |
| • | Originations in the third quarter of $1.4 billion were down 55.5 percent, or $1.8 billion, compared to the third quarter of 2007. |
| • | Managed loans of $22.3 billion as of September 30, 2008 were down 4.7 percent relative to the second quarter of 2008 and down 8.3 percent from the third quarter of 2007. |
16
International highlights
The International businesses posted $12.1 million in net income in the third quarter, a decline from both the second quarter of 2008 and the prior year quarter. The main driver of the decline in profitability was an increase in allowance in light of growing economic weakness in the UK. The company remains cautious on the UK business and continues to shrink the portfolio. The Canadian credit card business continues to perform well, with stable credit performance and solid returns.
| • | International’s net income of $12.1 million declined $21.6 million compared to $33.7 million in the second quarter of 2008, and declined $35.3 million compared to $47.4 million from the third quarter of 2007. |
| • | Charge-offs of 5.90 percent decreased 17 basis points from 6.07 percent in the second quarter of 2008, but increased 45 basis points from 5.45 percent in the third quarter of 2007. |
| • | Delinquencies decreased 11 basis points to 5.24 percent from 5.35 percent in the second quarter of 2008 but increased 55 basis points from 4.69 percent in the third quarter of 2007. |
| • | Managed loans of $10.3 billion as of September 30, 2008 were down 4.5 percent relative to the second quarter of 2008 and down 11.1 percent from the third quarter of 2007. |
The company generates earnings from its managed loan portfolio, which includes both on-balance sheet loans and securitized (off-balance sheet) loans. For this reason, the company believes managed financial measures to be useful to stakeholders. In compliance with Regulation G of the Securities and Exchange Commission, the company is providing a numerical reconciliation of managed financial measures to comparable measures calculated on a reported basis using generally accepted accounting principles (GAAP). Please see the schedule titled “Reconciliation to GAAP Financial Measures” attached to this release for more information.
Forward looking statements
The company cautions that its current expectations in this release, in the presentation slides available on the company’s website and in its Form 8-K dated October 16, 2008, for loan and deposit growth, the projected charge-off rate in the U.S. Card subsegment for the fourth quarter of 2008 and the first quarter of 2009, estimated loss levels for the 12 months ending September 30, 2009 underlying the provision expense in the third quarter of 2008, credit performance and trends, operating expense and operating efficiency ratios for the full year 2008, dividends, including future financial and operating results, and the company’s plans, objectives, expectations, and intentions, are forward-looking statements and actual results could differ materially from current expectations due to a number of factors, including: general economic conditions in the U.S., the UK, or the company’s local
17
markets, including conditions affecting interest rates and consumer income and confidence, spending, and savings which may affect consumer bankruptcies, defaults, charge-offs and deposit activity; changes in the labor and employment market; changes in the credit environment; the company’s ability to execute on its strategic and operational plans; competition from providers of products and services that compete with the company’s businesses; increases or decreases in the company’s aggregate accounts and balances, or the growth rate and/or composition thereof; the risk that the benefits of the company’s cost savings initiative may not be fully realized; changes in the reputation of or expectations regarding the financial services industry or the company with respect to practices, products or financial condition; financial, legal, regulatory, tax or accounting changes or actions, including with respect to any litigation matter involving the company; and the success of the company’s marketing efforts in attracting or retaining customers. A discussion of these and other factors can be found in the company’s annual report and other reports filed with the Securities and Exchange Commission, including, but not limited to, the company’s reports on Form 10-K for the fiscal year ended December 31, 2007, reports on Form 10-Q for the quarters ended March 31, 2008 and June 30, 2008, and report on Form 8-K filed September 24, 2008.
About Capital One
Capital One Financial Corporation (www.capitalone.com) is a financial holding company whose subsidiaries collectively had $98.9 billion in deposits and $147.3 billion in managed loans outstanding as of September 30, 2008. Headquartered in McLean, VA, Capital One has 739 locations primarily in New York, New Jersey, Texas, and Louisiana. It is a diversified bank whose principal subsidiaries, Capital One, N.A. and Capital One Bank (USA), N. A., offer a broad spectrum of financial products and services to consumers, small businesses and commercial clients. A Fortune 500 company, Capital One trades on the New York Stock Exchange under the symbol “COF” and is included in the S&P 100 index.
###
NOTE: Third quarter 2008 financial results, SEC Filings, and second quarter earnings conference call slides are accessible on Capital One’s home page (www.capitalone.com). Choose “Investors” on the bottom of the home page to view and download the earnings press release, slides, and other financial information. Additionally, a podcast and webcast of today’s 5:00 pm (ET) earnings conference call is accessible through the same link.
18
 Third quarter 2008
results October 16, 2008 Exhibit 99.2 |
 2 Forward looking statements Please note that the following materials containing information regarding Capital One’s financial
performance speak only as of the particular date or dates indicated in these materials. Capital
One does not undertake any obligation to update or revise any of the information contained herein whether as a result of new information, future events or otherwise. Certain statements in this presentation and other oral and written
statements made by Capital One from time to time are forward-looking statements, including those that discuss, among other things, strategies, goals, outlook or other non-historical
matters; projections, revenues, income, returns, earnings per share or other financial measures
for Capital One; future financial and operating results; and Capital One’s plans, objectives, expectations and intentions; and the assumptions that underlie these matters. To the extent that any such information
is forward-looking, it is intended to fit within the safe harbor for forward-looking
information provided by the Private Securities Litigation Reform Act of 1995. Numerous factors could cause our actual results to differ materially from those described in such forward-looking statements, including, among other
things: general economic and business conditions in the U.S., the UK, or Capital
One’s local markets, including conditions affecting consumer income and confidence, spending and repayments, changes in the credit environment, including an increase or decrease in credit losses or changes in the interest rate
environment; competition from providers of products and services that compete with Capital
One’s businesses; financial, legal, regulatory, tax or accounting changes or actions, including actions with respect to litigation matters involving Capital One; increases or decreases in our aggregate accounts or consumer
loan balances or the growth rate or composition thereof; the amount and rate of deposit growth;
changes in the reputation of or expectations regarding the financial services industry and/or Capital One with respect to practices, products or financial condition; the risk that synergies from Capital One’s
acquisitions may not be fully realized or may take longer to realize than expected; disruptions
from Capital One’s acquisitions negatively impacting Capital One’s ability to maintain relationships with customers, employees or suppliers; the risk that the benefits of Capital One’s cost savings initiatives may not
be fully realized; Capital One’s ability to access the capital markets at attractive rates
and terms to fund its operations and future growth; losses associated with new or changed products or services; Capital One’s ability to execute on its strategic and operational plans; any significant disruption in Capital
One’s operations or technology platform; Capital One’s ability to effectively control
costs; the success of Capital One’s marketing efforts in attracting and retaining customers; Capital One’s ability to recruit and retain experienced management personnel; changes in the labor and employment market; and other factors
listed from time to time in reports that Capital One files with the Securities and Exchange
Commission (the “SEC”), including, but not limited to, factors set forth under the caption “Risk Factors” in its Annual Report on Form 10-K for the year ended December 31, 2007, its Quarterly Report on Form 10-Q
for the quarters ended March 31, 2008, and June 30, 2008, and its current report on form
8-K filed September 24, 2008. You should carefully consider the factors discussed above in evaluating these forward-looking statements. All information in these slides is based on the consolidated results of
Capital One Financial Corporation, unless otherwise noted. A reconciliation of any non-GAAP
financial measures included in this presentation can be found in Capital One’s most recent Form 10-K concerning annual financial results, available on Capital One’s website at www.capitalone.com in Investor Relations under “About Capital One.” |
 3 • Diluted EPS of $1.00; EPS from Continuing Operations of $1.03 – Continuing Ops EPS down $1.06 from Q307, driven by higher provision expense – Continuing Ops EPS down $0.21 from Q208, driven by higher provision expense, partially offset by higher revenue and lower expenses • Credit performance in the quarter largely in line with prior expectations – Managed chargeoff rate up 15bp from Q208 to 4.30% – Managed delinquency rate up 35bp from Q208 to 3.99% – Built allowance by $209 million; consistent with outlook for $7.2 billion in managed charge- offs through Q309 • Balance sheet and diversified funding remain sources of strength in a volatile market – Opportunistic issuance of common stock and continued internal capital generation adding to excess capital; TCE ratio up 29bps to 6.47% – Immediately available liquidity of $32B – Average deposits increased $6B from Q208 to $95.3B; average cost of deposits declined 6 bps Third quarter 2008 highlights |
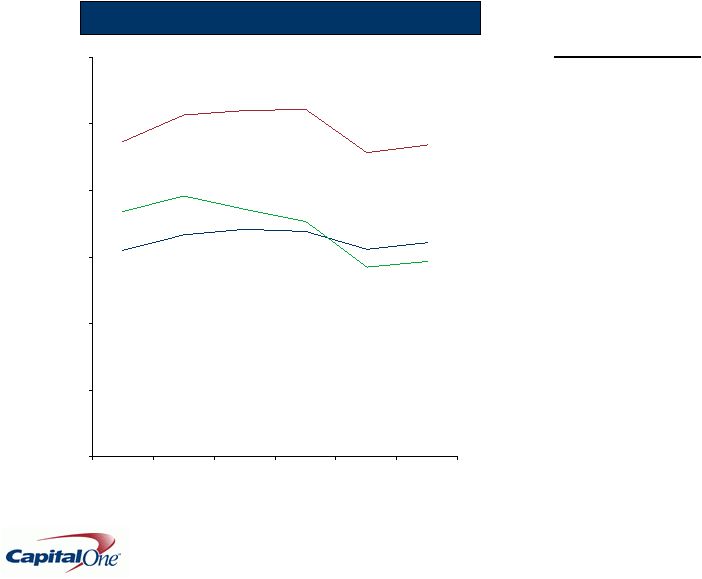 4 Margins improved slightly in the quarter 9.38% 9.48% 9.12% 6.43% 6.19% 6.22% 5.86% 7.37% 5.70% 0% 2% 4% 6% 8% 10% 12% Q207 Q307 Q407 Q108 Q208 Q308 Margins as % of Managed Assets Revenue Margin Net Interest Margin Risk-Adjusted Margin Q308 Drivers • Higher fees as early stage delinquencies rose • Seasonal impacts on fee recognition • Lower cost of funds • I/O strip write-down of $67M • No material one-time items |
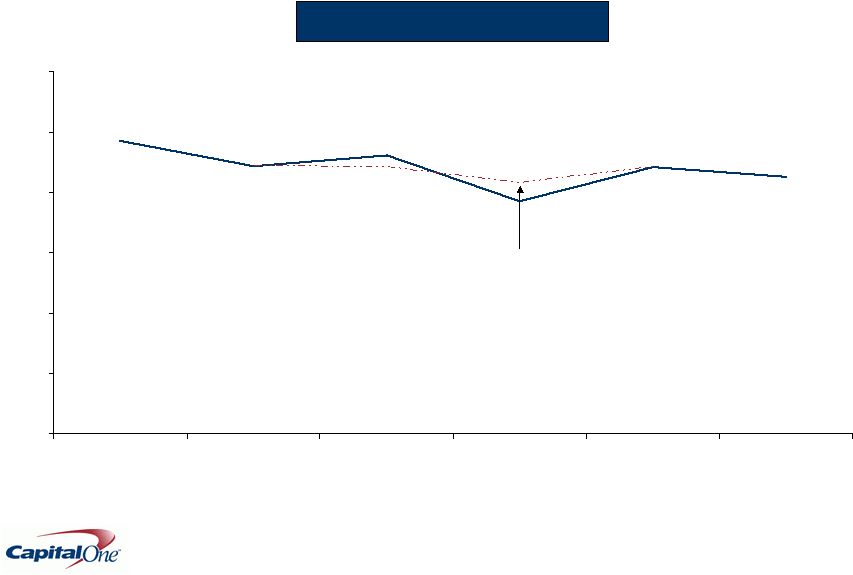 5 We continue to drive efficiency gains 42.6% 44.2% 48.6% 0% 10% 20% 30% 40% 50% 60% Q207 Q307 Q407 Q108 Q208 Q308 Efficiency Ratio Excluding Visa one-time impacts |
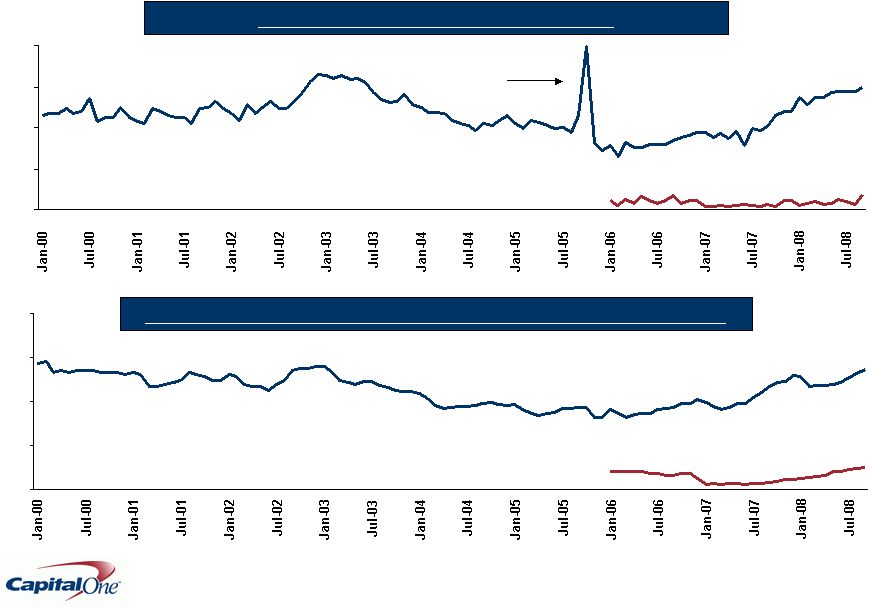 6 Credit metrics continues to perform in-line with expectations Monthly Managed Net Charge-off Rate Monthly Managed Delinquency and Non-Performing Loan Rate Bankruptcy Filing Spike National Lending Local Banking Local Banking: Non-performing loans as % of loans National Lending 30+ Delinquency Rate Q308: 5.85% Q308: 0.46% Q308 5.43% Q308 0.96% 0% 2% 4% 6% 8% 0% 2% 4% 6% 8% |
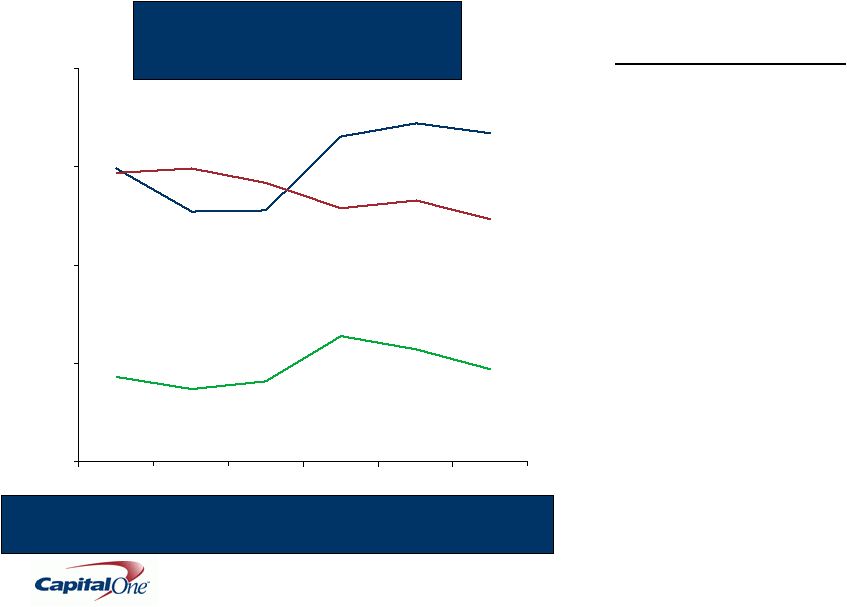 7 Allowance coverage ratios remain high 149% 172% 167% 47% 43% 57% 147% 133% 123% 0% 50% 100% 150% 200% Q207 Q307 Q407 Q108 Q208 Q308 National Lending Segment Allowance as % of Reported 30+ Delinquencies US Card Auto International Allowance as % of Reported Loans 2.3% 2.4% 2.9% 3.3% 3.4% Quarterly Highlights • Increased allowance for loan losses by $209M to $3.5B • Allowance consistent with outlook for $7.2B in managed charge-offs over next 12 months • Allowance as % of reported 30+ delinquencies declined due to: – Higher proportion of early stage (more collectible) delinquencies – Seasonality 3.6% |
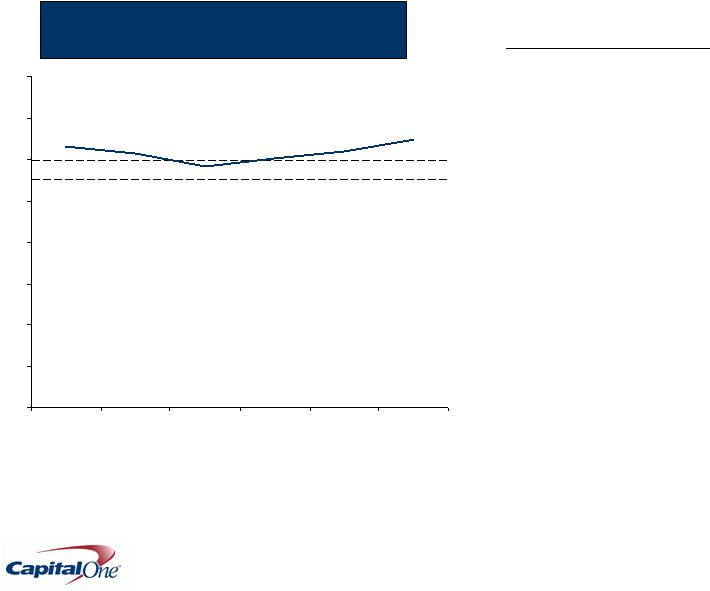 8 Tangible Common Equity to Tangible Managed Assets Ratio We remain well above our capital targets Target Range Quarterly Highlights • Issued approximately $750M of common stock • TCE ratio increased due to retained earnings growth and stock issuance • Tier 1 risk-based capital ratio of 11.9% (estimated) 6.47% 6.18% 6.33% 0% 1% 2% 3% 4% 5% 6% 7% 8% Q2 0 7 Q3 0 7 Q4 0 7 Q1 0 8 Q2 0 8 Q3 0 8 |
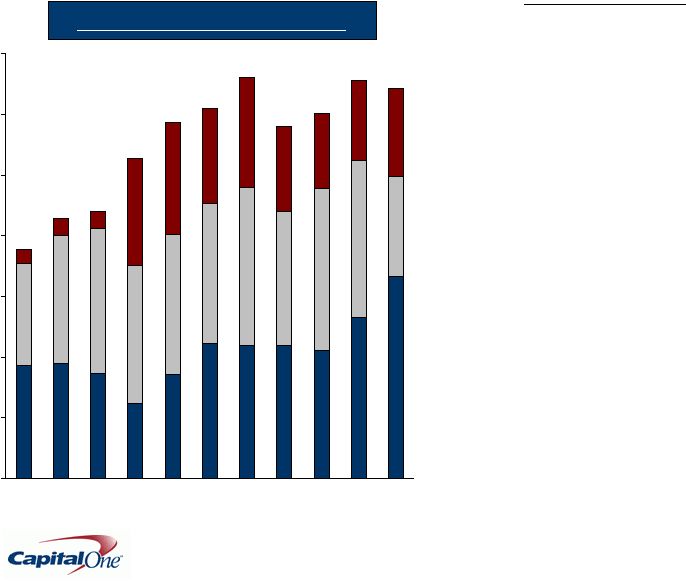 9 We continue to maintain ample liquidity $B Readily Available Liquidity Undrawn FHLB Capacity Unencumbered Securities Undrawn Conduit $32B Q308 Highlights • $5.7B Holding company cash covers parent obligations for 2+ years, including dividend • $32B of readily available liquidity is 4x next 12 months of debt maturities – $7.8B of debt maturities in the next 12 months – Long funds position – No overnight funding or repo • Funding in quarter was principally deposits – $6.5B net deposit growth • $7.2B in undrawn FHLB advance capacity • $7.8B undrawn conduits: 3 year deals, staggered maturities, backed by strong commercial banks – Renewed $5.3B during Q308 – $3B maturing in 2009 • $16.7B unencumbered securities in $27B investment portfolio (97% rated AAA) 0 5 10 15 20 25 30 35 1Q06 2Q06 3Q06 4Q06 1Q07 2Q07 3Q07 4Q07 1Q08 Q208 Q308 |
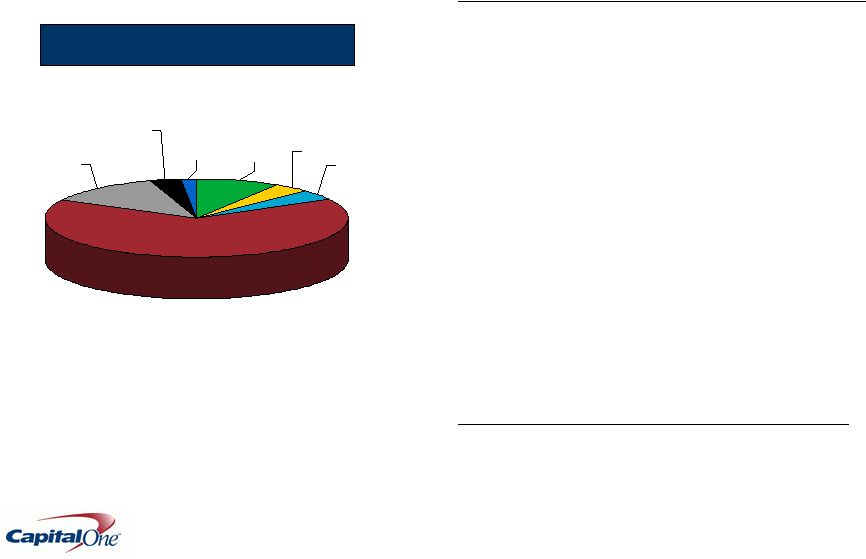 10 Our conservative investment portfolio is a foundation of our strong balance sheet What is in our $27B investment portfolio • 65% Agency MBS: Guaranteed pass-throughs and CMOs • 13% Non-Agency MBS: – Mostly AAA rated, prime jumbo collateral – More than 2/3 super senior credit enhancement – Less than 1% backed by subprime/Alt-A • 9% AAA-rated ABS: Credit card, auto and student loan • 4% Treas/Agency: Predominantly GSE debt issued by Freddie, Fannie and FHLB • 4% CMBS: Short senior structures backed by strong collateral • 3% FHLB/FED Stock: Required holding to access Fed and FHLB lending facilities • 2% Other: Predominantly municipal securities What is not in our investment portfolio • No SIV’s, CDO’s, leveraged loans • No exposure to equity or hybrids • No securities backed by Option ARMs Non-Agency MBS 13% FHLB/FED Stock 3% Other 2% ABS 9% CMBS 4% Treas/Agency 4% Agency MBS 65% Q308 Investment Portfolio Mix |
 11 Capital One delivered an operating profit of $386M despite increasing headwinds Net Income from Continuing Operations ($Millions) Q308 Q208 Q108 Q407 Q307 National Lending US Card $ 345.0 $ 340.4 $ 491.1 $ 498.7 $ 626.8 Auto Finance 14.5 33.6 (82.4) (112.4) (3.8) International 12.1 33.7 33.3 54.7 47.4 SUBTOTAL 371.6 407.6 442.0 441.0 670.5 Local Banking 88.2 67.1 75.8 103.6 195.5 Other (74.0) (12.2) 114.6 (223.0) (49.6) Total Company $ 385.8 $ 462.5 $ 632.6 $ 321.6 $ 816.4 |
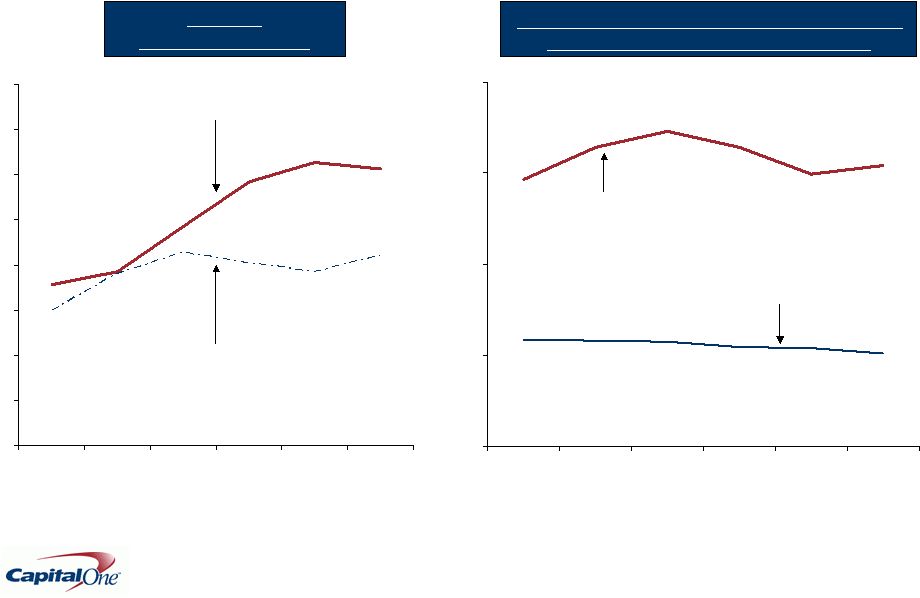 12 Our US Card business continues to deliver profits and generate capital despite a deteriorating economic environment 3.85% 4.84% 5.85% 3.56% 6.26% 6.13% 3.80% 2.98% 4.28% 4.04% 3.85% 4.20% 0% 1% 2% 3% 4% 5% 6% 7% 8% Q207 Q307 Q407 Q108 Q208 Q308 US Card Credit Risk Metrics 15.42% 14.96% 14.67% 16.42% 17.31% 16.42% 5.09% 5.38% 5.48% 5.76% 5.88% 5.81% 0% 5% 10% 15% 20% Q207 Q307 Q407 Q108 Q208 Q308 US Card Revenue Margin and Non-Interest Expenses as a % of Average Loans Revenue Margin Managed Net Charge-off Rate Non-Interest Expenses as a % of Average Loans Managed 30+ Delinquency Rate |
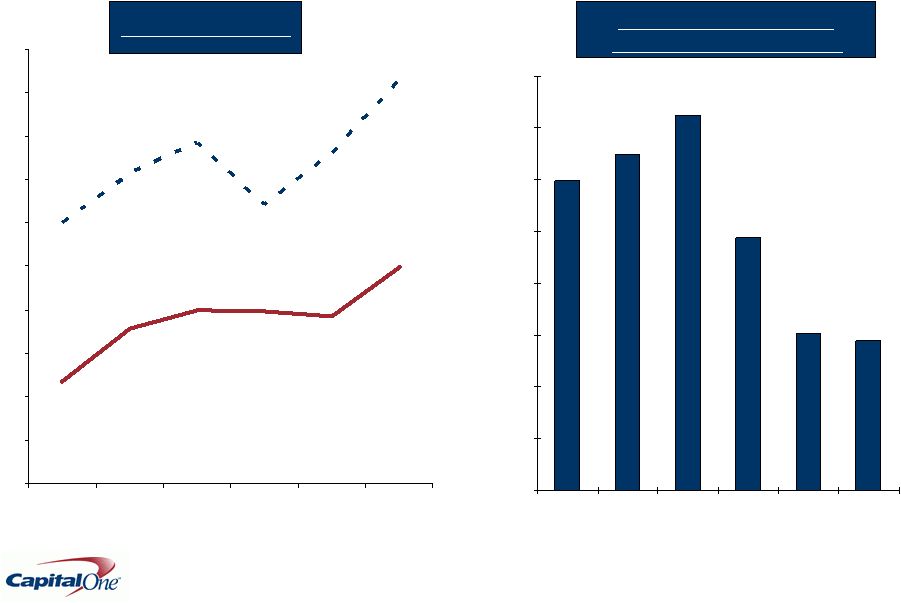 13 5.00% 3.84% 2.35% 3.56% 3.98% 4.00% 9.32% 7.62% 6.42% 7.84% 7.15% 6.00% 0% 1% 2% 3% 4% 5% 6% 7% 8% 9% 10% Q207 Q307 Q407 Q108 Q208 Q308 Credit Risk Metrics Managed Net Charge-off Rate Managed 30+ Delinquency Rate $3.0 $3.2 $3.6 $2.4 $1.5 $1.4 $0.0 $0.5 $1.0 $1.5 $2.0 $2.5 $3.0 $3.5 $4.0 Q207 Q307 Q407 Q108 Q208 Q308 We’ve retrenched and repositioned our auto business for resilience Auto Loan Originations and Managed Loans ($B) Total Outstandings ($B) $24.1 $24.3 $25.1 $24.6 $23.4 $22.3 |
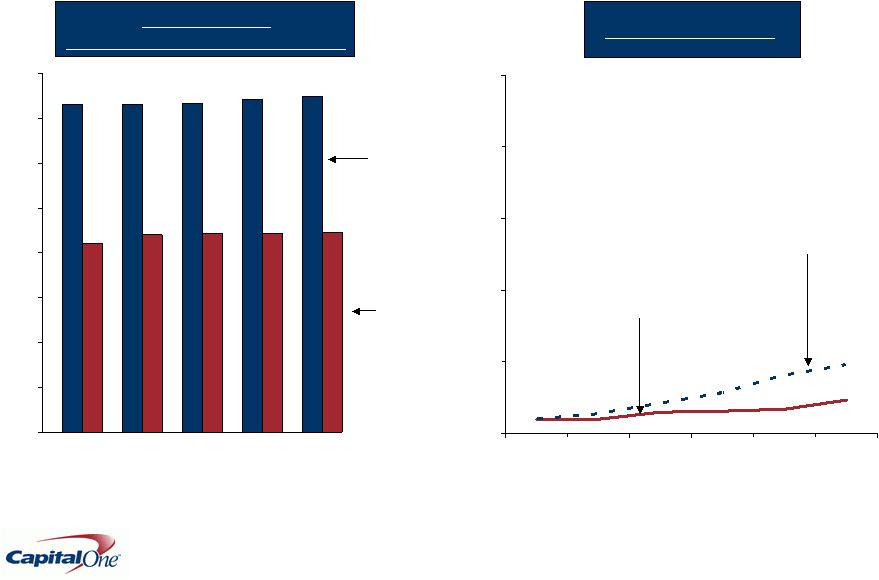 14 In the most turbulent banking environment in a generation, our Local Banking business continues to manage credit exposures and grow deposits while maintaining pricing discipline and margins 0.46% 0.34% 0.19% 0.20% 0.31% 0.29% 0.96% 0.81% 0.56% 0.41% 0.27% 0.19% 0% 1% 2% 3% 4% 5% Q207 Q307 Q407 Q108 Q208 Q308 Credit Risk Metrics Managed Net Charge-off Rate Non Performing Loans as a % of Loans $0 $10 $20 $30 $40 $50 $60 $70 $80 Local Banking Deposit and Loan Portfolio ($B) Loans Deposits Q307 Q407 Q108 Q208 Q308 $72.8 $42.2 $73.1 $44.0 $44.2 $73.4 $74.2 $44.3 $44.7 $75.0 |
 15 We expect sound operating metrics in 2008, despite increasing credit headwinds Commentary Loan/Deposit Growth Flat average loans High single-digit growth in average deposits Revenue Growth Modest decline expected in Q4 revenues due to seasonality and Prime/LIBOR risk Cost Management Capital Management Continue $0.375 quarterly dividend No share repurchases until economic outlook improves Credit Expectations Allowance at 9/30/08 consistent with outlook for $7.2 billion in managed charge-offs over the next 12 months 2008 Outlook Low single-digit decline in ending loans Double-digit growth in ending deposits Low-to mid-40%’s efficiency ratio 2008 OpEx around $6.2B TCE ratio above 5.5-6.0% target Continued economic weakness US Card charge-off rate around 7% for Q408 Low-to-mid single digits Revenue trends will drive efficiency ratio -- Q4 efficiency ratio expected to trend higher |
 16 Despite continuing economic headwinds, Capital One remains well positioned to deliver value through the cycle Strong Position Decisive Actions • Resilient businesses • Conservatism imbedded in underwriting decisions • Strong balance sheet – Substantial and growing deposit base – Broad funding flexibility – Fortified liquidity – Strong capital position • Pulled back on loan growth across all businesses – Tightened underwriting – Recalibrated underwriting models and approaches • Retrenched and repositioned Auto Finance • Pulled back or exited least resilient businesses • Increased collections intensity • Aggressively managing costs • Raised equity capital from a position of strength |
 |