
UNITED STATES
SECURITIES AND EXCHANGE COMMISSION
Washington, DC 20549
FORM 8-K
CURRENT REPORT
Pursuant to Section 13 OR 15(d) of
The Securities Exchange Act of 1934
April 17, 2008
Date of Report (Date of earliest event reported)
CAPITAL ONE FINANCIAL CORPORATION
(Exact name of registrant as specified in its chapter)
| Delaware | 1-13300 | 54-1719854 | ||
| (State or other jurisdiction of incorporation) |
(Commission File Number) |
(IRS Employer Identification No.) |
| 1680 Capital One Drive, McLean, Virginia |
22102 | |
| (Address of principal executive offices) | (Zip Code) |
Registrant’s telephone number, including area code: (703) 720-1000
(Former name or former address, if changed since last report)
Check the appropriate box below if the Form 8-K filing is intended to simultaneously satisfy the filing obligation of the registrant under any of the following provisions (see General Instruction A.2. below):
| ¨ | Written communications pursuant to Rule 425 under the Securities Act (17 CFR 230.425) |
| ¨ | Soliciting material pursuant to Rule 14a-12 under the Exchange Act (17 CFR 240.14a-12) |
| ¨ | Pre-commencement communications pursuant to Rule 14d-2(b) under the Exchange Act (17 CFR 240.14d-2(b)) |
| ¨ | Pre-commencement communications pursuant to Rule 13e-4(c) under the Exchange Act (17 CFR 240.13e-4(c)) |
| Item 2.02. | Results of Operations and Financial Condition |
On April 17, 2008, the Company issued a press release announcing its financial results for the first quarter ended March 31, 2008. A copy of the Company’s press release is attached and filed herewith as Exhibit 99.1 to this Form 8-K and is incorporated herein by reference.
The Company’s consolidated financial statements prepared in accordance with generally accepted accounting principles (“GAAP”) are referred to as its “reported” financial statements. Loans included in securitization transactions which qualified as sales under GAAP have been removed from the Company’s “reported” balance sheet. However, servicing fees, finance charges, and other fees, net of charge-offs, and interest paid to investors of securitizations are recognized as servicing and securitizations income on the “reported” income statement.
The Company’s “managed” consolidated financial statements reflect adjustments made related to effects of securitization transactions qualifying as sales under GAAP. The Company generates earnings from its “managed” loan portfolio which includes both the on-balance sheet loans and off-balance sheet loans. The Company’s “managed” income statement takes the components of the servicing and securitizations income generated from the securitized portfolio and distributes the revenue and expense to appropriate income statement line items from which it originated. For this reason the Company believes the “managed” consolidated financial statements and related managed metrics to be useful to stakeholders.
| Item 7.01. | Regulation FD Disclosure. |
The Company hereby furnishes the information in Exhibit 99.2 hereto, First Quarter Earnings Presentation for the quarter ended March 31, 2008.
Note: Information in Exhibit 99.2 furnished pursuant to Item 7.01 shall not be deemed to be “filed” for the purposes of Section 18 of the Securities Exchange Act of 1934 or otherwise subject to the liabilities of that section. This report will not be deemed an admission as to the materiality of any information in the report that is required to be disclosed solely by Regulation FD. Furthermore, the information provided in Exhibit 99.2 shall not be deemed to be incorporated by reference into the filings of the Company under the Securities Act of 1933.
2
| Item 8.01. | Other Events. |
| (a) | See attached press release, at Exhibit 99.1. |
| (b) | Cautionary Factors. |
The attached press release and information provided pursuant to Items 2.02, 7.01 and 9.01 contain forward-looking statements, which involve a number of risks and uncertainties. The Company cautions readers that any forward-looking information is not a guarantee of future performance and that actual results could differ materially from those contained in the forward-looking information as a result of various factors including, but not limited to, the following:
| • | general economic and business conditions in the U.S. and or UK, including conditions affecting employment levels, interest rates, consumer income, spending and savings that may affect consumer bankruptcies, defaults, charge-offs, and deposit activity; |
| • | an increase or decrease in credit losses (including increases due to a worsening of general economic conditions in the credit environment); |
| • | continued intense competition from numerous providers of products and services which compete with the Company’s businesses; |
| • | the success, timeliness and financial impact of the Company’s restructuring initiative, including costs, cost savings and other benefits; |
| • | changes in interest rates; |
| • | the success of the Company’s marketing efforts; |
| • | the ability of the Company to continue to securitize its credit cards and consumer loans and to otherwise access the capital markets at attractive rates and terms to capitalize and fund its operations and future growth; |
| • | financial, legal, regulatory, accounting changes or actions that may affect investment in, or the overall performance of, a product or business; |
| • | with respect to financial and other products, changes in the Company’s aggregate loan balances and/or number of customers and the growth rate and composition thereof, including changes resulting from factors such as shifting product mix, amount of actual marketing expenses made by the Company and attrition of loan balances; |
| • | the amount of deposit growth; |
| • | general market conditions in the mortgage industry; |
| • | changes in the reputation of the credit card industry and/or the Company with respect to practices or products; |
| • | any significant disruption in our operations or technology platform; |
| • | the Company’s ability to maintain a compliance infrastructure suitable for its size and complexity; |
| • | the amount of, and rate of growth in, the Company’s expenses as the Company’s business develops or changes or as it expands into new market areas; |
| • | the ability of the Company to build the operational and organizational infrastructure necessary to engage in new businesses; |
| • | the Company’s ability to execute on its strategic and operational plans; |
| • | any significant disruption of, or loss of public confidence in, the United States Mail service affecting our response rates and consumer payments; |
| • | the ability of the Company to recruit and retain experienced personnel to assist in the management and operations of new products and services; |
| • | the risk that the businesses acquired by the Company will not be integrated successfully; |
| • | the risk that the cost savings and any other synergies from the acquisitions may not be fully realized or may take longer to realize than expected; |
| • | disruption from the acquisitions making it more difficult to maintain relationships with customers, employees or suppliers; and |
| • | other risk factors listed from time to time in the Company’s SEC reports including, but not limited to, the Annual Report on Form 10-K for the year ended December 31, 2007. |
3
| Item 9.01. | Financial Statements, Pro Forma Financial Information and Exhibits. |
| (c) | Exhibits. |
| Exhibit No. |
Description of Exhibit | |
| 99.1 | Press release, dated April 17, 2008. | |
| 99.2 | First Quarter Earnings Presentation. |
Earnings Conference Call Webcast Information.
Capital One will hold an earnings conference call on April 17, 2008, 5:00 PM Eastern time. The conference call will be accessible through live webcast. Interested investors and other interested individuals can access the webcast via Capital One’s home page (http://www.capitalone.com). Choose “Investors” to access the Investor Center and view and/or download the earnings press release, a reconciliation to GAAP financial measures and other relevant financial information. The replay of the webcast will be archived on Capital One’s website through June 30, 2008.
SIGNATURE
Pursuant to the requirements of the Securities Exchange Act of 1934, the Company has duly caused this Current Report on Form 8-K to be signed on its behalf by the undersigned, hereunto duly authorized.
| CAPITAL ONE FINANCIAL CORPORATION | ||||
| Dated: April 17, 2008 | By: | /s/ GARY L. PERLIN | ||
| Gary L. Perlin Chief Financial Officer | ||||
5
Exhibit 99.1
CAPITAL ONE FINANCIAL CORPORATION (COF)
FINANCIAL & STATISTICAL SUMMARY
REPORTED BASIS
| 2008 | 2007 | 2007 | 2007 | 2007 | ||||||||||||||||
| (in millions, except per share data and as noted) |
Q1 | Q4 | Q3 | Q2 | Q1 | |||||||||||||||
| Earnings (Reported Basis) |
||||||||||||||||||||
| Net Interest Income |
$ | 1,811.9 | $ | 1,762.3 | $ | 1,624.5 | $ | 1,538.6 | (7) | $ | 1,604.5 | |||||||||
| Non-Interest Income |
2,056.5 | (12),(13) | 2,158.3 | (11) | 2,149.7 | 1,971.9 | 1,774.4 | (10) | ||||||||||||
| Total Revenue (1) |
3,868.4 | 3,920.6 | 3,774.2 | 3,510.5 | 3,378.9 | |||||||||||||||
| Provision for Loan Losses |
1,079.1 | 1,294.2 | 595.5 | 396.7 | 350.0 | |||||||||||||||
| Marketing Expenses |
297.8 | 358.2 | 332.7 | 326.1 | 330.9 | |||||||||||||||
| Restructuring Expenses (2) |
52.8 | 27.8 | 19.4 | 91.1 | — | |||||||||||||||
| Operating Expenses |
1,471.7 | (3),(4) | 1,749.2 | (3),(4) | 1,582.2 | (3) | 1,617.4 | (3),(8) | 1,643.2 | (3) | ||||||||||
| Income Before Taxes |
967.0 | 491.2 | 1,244.4 | 1,079.2 | 1,054.8 | |||||||||||||||
| Tax Rate |
34.6 | % | 34.5 | % | 34.4 | % | 28.9 | %(5) | 35.0 | % | ||||||||||
| Income From Continuing Operations, Net of Tax |
$ | 632.6 | $ | 321.6 | $ | 816.4 | $ | 767.6 | $ | 686.1 | ||||||||||
| Loss From Discontinued Operations, Net of Tax (6) |
(84.1 | )(14) | (95.0 | ) | (898.0 | ) | (17.2 | ) | (11.1 | ) | ||||||||||
| Net Income (Loss) |
$ | 548.5 | $ | 226.6 | $ | (81.6 | ) | $ | 750.4 | $ | 675.0 | |||||||||
| Common Share Statistics |
||||||||||||||||||||
| Basic EPS: |
||||||||||||||||||||
| Income From Continuing Operations |
$ | 1.71 | $ | 0.85 | $ | 2.11 | $ | 1.96 | $ | 1.68 | ||||||||||
| Loss From Discontinued Operations |
$ | (0.23 | ) | $ | (0.25 | ) | $ | (2.32 | ) | $ | (0.04 | ) | $ | (0.03 | ) | |||||
| Net Income (Loss) |
$ | 1.48 | $ | 0.60 | $ | (0.21 | ) | $ | 1.92 | $ | 1.65 | |||||||||
| Diluted EPS: |
||||||||||||||||||||
| Income From Continuing Operations |
$ | 1.70 | $ | 0.85 | $ | 2.09 | $ | 1.93 | $ | 1.65 | ||||||||||
| Loss From Discontinued Operations |
$ | (0.23 | ) | $ | (0.25 | ) | $ | (2.30 | ) | $ | (0.04 | ) | $ | (0.03 | ) | |||||
| Net Income (Loss) |
$ | 1.47 | $ | 0.60 | $ | (0.21 | ) | $ | 1.89 | $ | 1.62 | |||||||||
| Dividends Per Share |
$ | 0.375 | $ | 0.03 | $ | 0.03 | $ | 0.03 | $ | 0.03 | ||||||||||
| Tangible Book Value Per Share (period end) |
$ | 29.94 | $ | 29.00 | $ | 28.88 | $ | 29.11 | $ | 29.76 | ||||||||||
| Stock Price Per Share (period end) |
$ | 49.22 | $ | 47.26 | $ | 66.43 | $ | 78.44 | $ | 75.46 | ||||||||||
| Total Market Capitalization (period end) |
$ | 18,442.7 | $ | 17,623.3 | $ | 25,602.1 | $ | 30,701.4 | $ | 31,112.2 | ||||||||||
| Shares Outstanding (period end) |
374.7 | 372.9 | 385.4 | 391.4 | 412.3 | |||||||||||||||
| Shares Used to Compute Basic EPS |
370.7 | 375.6 | 386.1 | 390.8 | 408.7 | |||||||||||||||
| Shares Used to Compute Diluted EPS |
372.3 | 378.4 | 390.8 | 397.5 | 415.5 | |||||||||||||||
| Reported Balance Sheet Statistics (period average) (A) |
||||||||||||||||||||
| Average Loans Held for Investment |
$ | 99,819 | $ | 97,785 | $ | 91,745 | $ | 91,145 | $ | 93,466 | ||||||||||
| Average Earning Assets |
$ | 127,820 | $ | 127,242 | $ | 118,354 | $ | 119,430 | $ | 120,766 | ||||||||||
| Average Assets |
$ | 149,460 | $ | 150,926 | $ | 143,291 | $ | 142,690 | $ | 143,130 | ||||||||||
| Average Interest Bearing Deposits |
$ | 74,167 | $ | 72,074 | $ | 73,338 | $ | 75,024 | $ | 74,654 | ||||||||||
| Total Average Deposits |
$ | 84,779 | $ | 83,813 | $ | 84,667 | $ | 86,525 | $ | 86,024 | ||||||||||
| Average Equity |
$ | 24,569 | $ | 24,733 | $ | 25,344 | $ | 25,128 | $ | 25,610 | ||||||||||
| Return on Average Assets (ROA) |
1.69 | % | 0.85 | % | 2.28 | % | 2.15 | % | 1.92 | % | ||||||||||
| Return on Average Equity (ROE) |
10.30 | % | 5.20 | % | 12.89 | % | 12.22 | % | 10.72 | % | ||||||||||
| Reported Balance Sheet Statistics (period end) (A) |
||||||||||||||||||||
| Loans Held for Investment |
$ | 98,356 | $ | 101,805 | $ | 93,789 | $ | 90,930 | $ | 90,869 | ||||||||||
| Total Assets |
$ | 150,428 | $ | 150,202 | $ | 143,884 | $ | 141,917 | $ | 143,832 | ||||||||||
| Interest Bearing Deposits |
$ | 76,624 | $ | 71,715 | $ | 72,285 | $ | 74,235 | $ | 76,113 | ||||||||||
| Total Deposits |
$ | 87,695 | $ | 82,761 | $ | 83,125 | $ | 85,471 | $ | 87,471 | ||||||||||
| Performance Statistics (Reported) (A) |
||||||||||||||||||||
| Net Interest Income Growth (annualized) |
11 | % | 34 | % | 22 | % | (16 | )% | 61 | % | ||||||||||
| Non Interest Income Growth (annualized) |
(19 | )% | 2 | % | 36 | % | 45 | % | 25 | % | ||||||||||
| Revenue Growth (annualized) |
(5 | )% | 16 | % | 30 | % | 16 | % | 41 | % | ||||||||||
| Net Interest Margin |
5.67 | % | 5.54 | % | 5.49 | % | 5.15 | % | 5.31 | % | ||||||||||
| Revenue Margin |
12.11 | % | 12.32 | % | 12.76 | % | 11.76 | % | 11.19 | % | ||||||||||
| Risk Adjusted Margin (B) |
9.71 | % | 10.28 | % | 11.13 | % | 10.41 | % | 9.77 | % | ||||||||||
| Non Interest Expense as a % of Average Loans Held for Investment (annualized) |
7.30 | % | 8.73 | % | 8.43 | % | 8.93 | % | 8.45 | % | ||||||||||
| Efficiency Ratio (C) |
45.74 | % | 53.75 | % | 50.74 | % | 55.36 | % | 58.42 | % | ||||||||||
| Asset Quality Statistics (Reported) (A) |
||||||||||||||||||||
| Allowance |
$ | 3,273 | $ | 2,963 | $ | 2,237 | $ | 2,113 | $ | 2,105 | ||||||||||
| Allowance as a % of Reported Loans Held for Investment |
3.33 | % | 2.91 | % | 2.39 | % | 2.32 | % | 2.32 | % | ||||||||||
| Net Charge-Offs |
$ | 767 | $ | 650 | $ | 480 | $ | 401 | $ | 430 | ||||||||||
| Net Charge-Off Rate |
3.07 | % | 2.66 | % | 2.09 | % | 1.76 | %(9) | 1.84 | % | ||||||||||
| Full-time equivalent employees (in thousands) |
25.4 | 27.0 | 27.5 | 29.5 | 30.8 | |||||||||||||||
1
CAPITAL ONE FINANCIAL CORPORATION (COF)
FINANCIAL & STATISTICAL SUMMARY
MANAGED BASIS (*)
| 2008 | 2007 | 2007 | 2007 | 2007 | ||||||||||||||||
| (in millions) |
Q1 | Q4 | Q3 | Q2 | Q1 | |||||||||||||||
| Earnings (Managed Basis) |
||||||||||||||||||||
| Net Interest Income |
$ | 2,976.8 | $ | 3,000.5 | $ | 2,803.4 | $ | 2,613.3 | (7) | $ | 2,602.5 | |||||||||
| Non-Interest Income |
1,606.7 | (12),(13) | 1,566.2 | (11) | 1,518.0 | 1,387.5 | 1,294.1 | (10) | ||||||||||||
| Total Revenue (1) |
4,583.5 | 4,566.7 | 4,321.4 | 4,000.8 | 3,896.6 | |||||||||||||||
| Provision for Loan Losses |
1,794.2 | 1,940.3 | 1,142.7 | 887.1 | 867.7 | |||||||||||||||
| Marketing Expenses |
297.8 | 358.2 | 332.7 | 326.1 | 330.9 | |||||||||||||||
| Restructuring Expenses (2) |
52.8 | 27.8 | 19.4 | 91.1 | — | |||||||||||||||
| Operating Expenses |
1,471.7 | (3),(4) | 1,749.2 | (3),(4) | 1,582.2 | (3) | 1,617.4 | (3),(8) | 1,643.2 | (3) | ||||||||||
| Income Before Taxes |
967.0 | 491.2 | 1,244.4 | 1,079.1 | 1,054.8 | |||||||||||||||
| Tax Rate |
34.6 | % | 34.5 | % | 34.4 | % | 28.9 | %(5) | 35.0 | % | ||||||||||
| Income From Continuing Operations, Net of Tax |
$ | 632.6 | $ | 321.6 | $ | 816.4 | $ | 767.6 | $ | 686.1 | ||||||||||
| Loss From Discontinued Operations, Net of Tax (6) |
(84.1 | )(14) | (95.0 | ) | (898.0 | ) | (17.2 | ) | (11.1 | ) | ||||||||||
| Net Income (Loss) |
$ | 548.5 | $ | 226.6 | $ | (81.6 | ) | $ | 750.4 | $ | 675.0 | |||||||||
| Managed Balance Sheet Statistics (period average) (A) |
||||||||||||||||||||
| Average Loans Held for Investment |
$ | 149,719 | $ | 148,362 | $ | 143,781 | $ | 142,616 | $ | 144,113 | ||||||||||
| Average Earning Assets |
$ | 175,709 | $ | 175,652 | $ | 168,238 | $ | 168,841 | $ | 169,358 | ||||||||||
| Average Assets |
$ | 198,516 | $ | 200,658 | $ | 194,528 | $ | 193,446 | $ | 193,034 | ||||||||||
| Return on Average Assets (ROA) |
1.27 | % | 0.64 | % | 1.68 | % | 1.59 | % | 1.42 | % | ||||||||||
| Managed Balance Sheet Statistics (period end) (A) |
||||||||||||||||||||
| Loans Held for Investment |
$ | 148,037 | $ | 151,362 | $ | 144,769 | $ | 143,498 | $ | 142,005 | ||||||||||
| Total Assets |
$ | 199,362 | $ | 198,908 | $ | 194,019 | $ | 193,682 | $ | 194,252 | ||||||||||
| Tangible Assets(D) |
$ | 185,962 | $ | 185,428 | $ | 180,363 | $ | 179,888 | $ | 180,501 | ||||||||||
| Tangible Common Equity (E) |
$ | 11,220 | $ | 10,814 | $ | 11,131 | $ | 11,393 | $ | 12,270 | ||||||||||
| Tangible Common Equity to Tangible Assets Ratio |
6.03 | % | 5.83 | % | 6.17 | % | 6.33 | % | 6.80 | % | ||||||||||
| % Off-Balance Sheet Securitizations |
34 | % | 33 | % | 35 | % | 37 | % | 36 | % | ||||||||||
| Performance Statistics (Managed) (A) |
||||||||||||||||||||
| Net Interest Income Growth (annualized) |
(3 | )% | 28 | % | 29 | % | 2 | % | 45 | % | ||||||||||
| Non Interest Income Growth (annualized) |
10 | % | 13 | % | 38 | % | 29 | % | 28 | % | ||||||||||
| Revenue Growth (annualized) |
1 | % | 23 | % | 32 | % | 11 | % | 39 | % | ||||||||||
| Net Interest Margin |
6.78 | % | 6.83 | % | 6.67 | % | 6.19 | % | 6.15 | % | ||||||||||
| Revenue Margin |
10.43 | % | 10.40 | % | 10.27 | % | 9.48 | % | 9.20 | % | ||||||||||
| Risk Adjusted Margin (B) |
7.06 | % | 7.45 | % | 7.83 | % | 7.37 | % | 6.97 | % | ||||||||||
| Non Interest Expense as a % of Average Loans Held for Investment (annualized) |
4.87 | % | 5.76 | % | 5.38 | % | 5.71 | % | 5.48 | % | ||||||||||
| Efficiency Ratio (C) |
38.61 | % | 46.15 | % | 44.31 | % | 48.58 | % | 50.66 | % | ||||||||||
| Asset Quality Statistics (Managed) (A) |
||||||||||||||||||||
| Net Charge-Offs |
$ | 1,482 | $ | 1,296 | $ | 1,027 | $ | 891 | $ | 947 | ||||||||||
| Net Charge-Off Rate |
3.96 | % | 3.49 | % | 2.86 | % | 2.50 | %(9) | 2.63 | % | ||||||||||
| (*) | The information in this statistical summary reflects the adjustment to add back the effect of securitization transactions qualifying as sales under generally accepted accounting principles. See accompanying schedule—“Reconciliation to GAAP Financial Measures”. |
2
CAPITAL ONE FINANCIAL CORPORATION (COF)
FINANCIAL & STATISTICAL SUMMARY NOTES
| (1) | In accordance with the Company’s finance charge and fee revenue recognition policy, the amounts billed to customers but not recognized as revenue were as follows: Q1 2008—$407.6 million, Q4 2007—$379.4 million, Q3 2007—$310.5 million, Q2 2007—$236.3 million, and Q1 2007—$213.6 million. |
| (2) | During the second quarter of 2007, the Company announced a broad-based initiative to reduce expenses and improve its competitive cost position. As part of this initiative $52.8 million, $27.8 million, $19.4 million and $91.1 million of restructuring charges were recognized as part of continuing operations during Q1 2008, Q4 2007, Q3 2007 and Q2 2007, respectively. |
| (3) | Includes core deposit intangible amortization expense of $49.8 million in Q1 2008, $51.1 million in Q4 2007, $52.4 million in Q3 2007, $53.7 million in Q2 2007 and $55.0 million in Q1 2007, and integration costs of $29.6 million in Q1 2008, $28.6 million in Q4 2007, $30.3 million in Q3 2007, $24.5 million in Q2 2007 and $14.6 million in Q1 2007. |
| (4) | In Q4 2007, the Company recognized a pre-tax charge of approximately $140 million for liabilities in connection with the Visa antitrust lawsuit settlement with American Express and estimated possible damages in connection with other pending Visa litigation. In Q1 2008, the Company, in connection with the Visa initial public offering (IPO), reversed approximately $91 million of these legal liabilities. |
| (5) | Includes a $69.0 million benefit in Q2 2007 resulting from changes in the Company’s international tax position and tax benefits from resolution of tax issues and a miscellaneous tax adjustment of $11.7 million in Q1 2007. |
| (6) | In Q3 2007, the Company shutdown the mortgage origination operations of its wholesale mortgage banking unit, GreenPoint Mortgage, realizing an after tax loss of $898.0 million. The results of the mortgage origination operation of GreenPoint have been accounted for as a discontinued operation and have been removed from the Company’s results of continuing operations for all periods presented. The results of GreenPoint’s mortgage servicing business are reported in continuing operations for all periods presented. Effective Q4 2007, GreenPoint’s held for investment commercial and consumer loan portfolio results are included in continuing operations. |
| (7) | Includes a $17.4 million gain from the early extinguishment of Trust Preferred Securities in Q2 2007 included as a component of interest expense. |
| (8) | Includes a charge of $39.8 million as a result of the accelerated vesting of equity awards made in connection with the transition of the management team for Capital One’s Local Banking business following the acquisition of North Fork. |
| (9) | Managed and reported net charge-off rate for Q2 2007 was positively impacted 11 and 17 basis points, respectively, due to the implementation of a change in customer statement generation from 30 to 25 days grace. The change did not have a material impact on Net Provision for Q2 2007. |
| (10) | Includes a $46.2 million gain resulting from the sale of a 7% stake in the privately held company, DealerTrack Holding Inc., a leading provider of on-demand software and data solutions for the automotive retail industry in Q1 2007. |
| (11) | During the fourth quarter 2007, the Company completed the sale of its interest in a relationship agreement to develop and market consumer credit products in the Spanish Market and recorded a gain related to this sale of approximately $30 million in non-interest income. |
| (12) | In Q1 2008 the Company recorded a gain of $109.0 million in non-interest income from the redemption of 2.5 million shares related to the Visa IPO. |
| (13) | In Q1 2008 the Company repurchased approximately $1.0 billion of certain senior unsecured debt, recognizing a gain of $52.0 million in non-interest income. The Company initiated the repurchases to take advantage of the current rate environment and replaced the borrowings with lower-rate unsecured funding. |
| (14) | In Q1 2008 the Company recorded a pre-tax expense of $104.2 million in discontinued operations to cover expected future claims made under representations and warranties provided by the Company on loans previously sold to third parties by GreenPoint’s mortgage origination operation. See also note (6) above. |
STATISTICS / METRIC DEFINITIONS
| (A) | Based on continuing operations. Average equity and return on equity are based on the Company’s stockholders’ equity. |
| (B) | Risk adjusted margin equals total revenue less net charge-offs as a percentage of average earning assets. |
| (C) | Efficiency ratio equals non-interest expense less restructuring expense divided by total revenue. |
| (D) | Tangible assets include managed assets less intangible assets. |
| (E) | Includes stockholders’ equity and preferred interests less intangible assets and related deferred tax liabilities. Tangible Common Equity on a reported and managed basis is the same. |
3
CAPITAL ONE FINANCIAL CORPORATION (COF)
SEGMENT FINANCIAL & STATISTICAL SUMMARY FOR CONTINUING OPERATIONS
MANAGED BASIS (1)
| 2008 | 2007 | 2007 | 2007 | 2007 | ||||||||||||||||
| (in thousands) |
Q1 | Q4 (7) | Q3 (7) | Q2 (7) | Q1 (7) | |||||||||||||||
| Local Banking: |
||||||||||||||||||||
| Interest Income |
$ | 1,575,325 | $ | 1,707,377 | $ | 1,751,898 | $ | 1,731,833 | $ | 1,746,213 | ||||||||||
| Interest Expense |
1,008,371 | 1,122,841 | 1,165,594 | 1,143,674 | 1,169,160 | |||||||||||||||
| Net interest income |
$ | 566,954 | $ | 584,536 | $ | 586,304 | $ | 588,159 | $ | 577,053 | ||||||||||
| Non-interest income |
215,469 | 206,002 | 232,662 | 254,401 | 246,573 | |||||||||||||||
| Provision for loan losses |
60,394 | 42,665 | (58,192 | ) | 23,929 | 23,776 | ||||||||||||||
| Other non-interest expenses |
605,351 | 589,943 | 577,309 | 580,788 | 585,915 | |||||||||||||||
| Income tax provision |
40,837 | 54,328 | 104,353 | 83,046 | 74,737 | |||||||||||||||
| Net income |
$ | 75,841 | $ | 103,602 | $ | 195,496 | $ | 154,797 | $ | 139,198 | ||||||||||
| Loans Held for Investment |
$ | 44,197,085 | $ | 43,972,795 | $ | 42,233,665 | $ | 41,919,645 | $ | 41,642,594 | ||||||||||
| Average Loans Held for Investment |
$ | 43,887,387 | $ | 43,128,767 | $ | 41,992,618 | $ | 42,110,537 | $ | 41,846,678 | ||||||||||
| Core Deposits(2) |
$ | 62,811,696 | $ | 62,977,637 | $ | 62,494,588 | $ | 63,619,337 | $ | 62,769,255 | ||||||||||
| Total Deposits |
$ | 73,387,227 | $ | 73,089,284 | $ | 72,795,566 | $ | 74,273,736 | $ | 74,315,914 | ||||||||||
| Loans Held for Investment Yield |
6.75 | % | 7.02 | % | 7.13 | % | 7.03 | % | 6.99 | % | ||||||||||
| Net Interest Margin—Loans (3) |
1.92 | % | 1.87 | % | 1.79 | % | 1.88 | % | 1.91 | % | ||||||||||
| Net Interest Margin—Deposits (4) |
1.93 | % | 2.05 | % | 2.09 | % | 2.01 | % | 1.99 | % | ||||||||||
| Efficiency Ratio (6) |
77.37 | % | 74.63 | % | 70.49 | % | 68.93 | % | 71.14 | % | ||||||||||
| Net charge-off rate |
0.31 | % | 0.28 | % | 0.19 | % | 0.19 | % | 0.15 | % | ||||||||||
| Non Performing Loans |
$ | 249,055 | $ | 178,385 | $ | 112,794 | $ | 80,781 | $ | 80,162 | ||||||||||
| Non Performing Loans as a % of Loans Held for Investment |
0.56 | % | 0.41 | % | 0.27 | % | 0.19 | % | 0.19 | % | ||||||||||
| Non-Interest Expenses as a % of Average Loans Held for Investment |
5.52 | % | 5.47 | % | 5.50 | % | 5.52 | % | 5.60 | % | ||||||||||
| Number of Active ATMs |
1,297 | 1,288 | 1,282 | 1,253 | 1,236 | |||||||||||||||
| Number of locations |
745 | 742 | 732 | 724 | 723 | |||||||||||||||
| National Lending (10): |
||||||||||||||||||||
| Interest Income |
$ | 3,530,017 | $ | 3,670,404 | $ | 3,504,019 | $ | 3,253,448 | $ | 3,247,815 | ||||||||||
| Interest Expense |
1,121,434 | 1,231,978 | 1,228,280 | 1,193,205 | 1,180,987 | |||||||||||||||
| Net interest income |
$ | 2,408,583 | $ | 2,438,426 | $ | 2,275,739 | $ | 2,060,243 | $ | 2,066,828 | ||||||||||
| Non-interest income |
1,226,114 | 1,370,655 | 1,274,688 | 1,133,318 | 1,092,066 | |||||||||||||||
| Provision for loan losses |
1,677,220 | 1,777,327 | 1,195,995 | 869,149 | 849,216 | |||||||||||||||
| Other non-interest expenses |
1,279,171 | 1,361,709 | 1,333,688 | 1,333,956 | 1,390,851 | |||||||||||||||
| Income tax provision |
236,203 | 229,084 | 350,277 | 341,323 | 316,479 | |||||||||||||||
| Net income |
$ | 442,103 | $ | 440,961 | $ | 670,467 | $ | 649,133 | $ | 602,348 | ||||||||||
| Loans Held for Investment |
$ | 103,003,402 | $ | 106,508,443 | $ | 102,556,271 | $ | 101,590,039 | $ | 100,371,532 | ||||||||||
| Average Loans Held for Investment |
$ | 104,973,633 | $ | 104,321,485 | $ | 101,805,584 | $ | 100,520,138 | $ | 102,276,581 | ||||||||||
| Core Deposits(2) |
$ | 2,171 | $ | 1,599 | $ | 470 | $ | 1,124 | $ | 3,212 | ||||||||||
| Total Deposits |
$ | 1,774,690 | $ | 2,050,861 | $ | 2,295,131 | $ | 2,411,435 | $ | 2,409,291 | ||||||||||
| Loans Held for Investment Yield |
13.45 | % | 14.07 | % | 13.77 | % | 12.95 | % | 12.70 | % | ||||||||||
| Net Interest Margin |
9.18 | % | 9.35 | % | 8.94 | % | 8.20 | % | 8.08 | % | ||||||||||
| Revenue Margin |
13.85 | % | 14.61 | % | 13.95 | % | 12.71 | % | 12.35 | % | ||||||||||
| Risk Adjusted Margin |
8.51 | % | 9.88 | % | 9.99 | % | 9.24 | % | 8.71 | % | ||||||||||
| Non-Interest Expenses as a % of Average Loans Held for Investment |
4.87 | % | 5.22 | % | 5.24 | % | 5.31 | % | 5.44 | % | ||||||||||
| Efficiency Ratio (6) |
35.19 | % | 35.75 | % | 37.56 | % | 41.77 | % | 44.03 | % | ||||||||||
| Net charge-off rate |
5.34 | % | 4.73 | % | 3.96 | % | 3.47 | % (5) | 3.65 | % | ||||||||||
| Delinquency Rate (30+ days) |
4.73 | % | 5.17 | % | 4.70 | % | 3.89 | % | 3.63 | % | ||||||||||
| Number of Loan Accounts (000s) |
48,065 | 48,537 | 48,473 | 48,536 | 48,667 | |||||||||||||||
| Other: |
||||||||||||||||||||
| Net interest income |
$ | 1,313 | $ | (22,449 | ) | $ | (58,605 | ) | $ | (35,057 | ) | $ | (41,427 | ) | ||||||
| Non-interest income |
165,102 | (10,425 | ) | 10,639 | (248 | ) | (44,563 | ) | ||||||||||||
| Provision for loan losses |
56,598 | 120,376 | 5,022 | (5,981 | ) | (5,330 | ) | |||||||||||||
| Restructuring expenses |
52,759 | 27,809 | 19,354 | 91,074 | — | |||||||||||||||
| Other non-interest expenses |
(115,004 | ) | 155,746 | 3,870 | 28,717 | (2,719 | ) | |||||||||||||
| Income tax provision (benefit) |
57,451 | (113,854 | ) | (26,620 | ) | (112,797 | ) | (22,519 | ) | |||||||||||
| Net income (loss) |
$ | 114,611 | $ | (222,951 | ) | $ | (49,592 | ) | $ | (36,318 | ) | $ | (55,422 | ) | ||||||
| Loans Held for Investment |
$ | 836,041 | $ | 881,179 | $ | (21,375 | ) | $ | (11,928 | ) | $ | (9,084 | ) | |||||||
| Core Deposits(2) |
$ | 10,729,004 | $ | 6,107,779 | $ | 6,373,515 | $ | 6,937,760 | $ | 7,532,854 | ||||||||||
| Total Deposits |
$ | 12,533,025 | $ | 7,621,031 | $ | 8,034,332 | $ | 8,786,315 | $ | 10,745,405 | ||||||||||
| Total: |
||||||||||||||||||||
| Interest Income |
$ | 4,628,257 | $ | 4,863,246 | $ | 4,646,431 | $ | 4,380,376 | $ | 4,359,663 | ||||||||||
| Interest Expense |
1,651,407 | 1,862,733 | 1,842,993 | 1,767,031 | 1,757,209 | |||||||||||||||
| Net interest income |
$ | 2,976,850 | $ | 3,000,513 | $ | 2,803,438 | $ | 2,613,345 | $ | 2,602,454 | ||||||||||
| Non-interest income |
1,606,685 | 1,566,232 | 1,517,989 | 1,387,471 | 1,294,076 | |||||||||||||||
| Provision for loan losses |
1,794,212 | 1,940,368 | 1,142,825 | 887,097 | 867,662 | |||||||||||||||
| Restructuring expenses |
52,759 | 27,809 | 19,354 | 91,074 | — | |||||||||||||||
| Other non-interest expenses |
1,769,518 | 2,107,398 | 1,914,867 | 1,943,461 | 1,974,047 | |||||||||||||||
| Income tax provision |
334,491 | 169,558 | 428,010 | 311,572 | 368,697 | |||||||||||||||
| Net Income |
$ | 632,555 | $ | 321,612 | $ | 816,371 | $ | 767,612 | $ | 686,124 | ||||||||||
| Loans Held for Investment |
$ | 148,036,528 | $ | 151,362,417 | $ | 144,768,561 | $ | 143,497,756 | $ | 142,005,042 | ||||||||||
| Core Deposits(2) |
$ | 73,542,871 | $ | 69,087,015 | $ | 68,868,573 | $ | 70,558,221 | $ | 70,305,321 | ||||||||||
| Total Deposits |
$ | 87,694,942 | $ | 82,761,176 | $ | 83,125,029 | $ | 85,471,486 | $ | 87,470,610 | ||||||||||
4
CAPITAL ONE FINANCIAL CORPORATION (COF)
NATIONAL LENDING SUBSEGMENT FINANCIAL & STATISTICAL SUMMARY FOR CONTINUING OPERATIONS
MANAGED BASIS (1), (10)
| (in thousands) |
2008 Q1 |
2007 Q4 (7) |
2007 Q3 (7) |
2007 Q2 (7) |
2007 Q1 (7) |
|||||||||||||||
| US Card: |
||||||||||||||||||||
| Interest Income |
$ | 2,433,665 | $ | 2,548,929 | $ | 2,418,890 | $ | 2,214,408 | $ | 2,225,128 | ||||||||||
| Interest Expense |
689,951 | 780,985 | 798,493 | 778,576 | 777,382 | |||||||||||||||
| Net interest income |
$ | 1,743,714 | $ | 1,767,944 | $ | 1,620,397 | $ | 1,435,832 | $ | 1,447,746 | ||||||||||
| Non-interest income |
1,070,831 | 1,163,795 | 1,107,801 | 971,894 | 892,668 | |||||||||||||||
| Provision for loan losses |
1,120,025 | 1,195,469 | 807,318 | 538,379 | 492,051 | |||||||||||||||
| Non-interest expenses |
938,860 | 976,118 | 965,351 | 965,556 | 1,027,549 | |||||||||||||||
| Income tax provision |
264,481 | 261,492 | 328,702 | 310,904 | 282,360 | |||||||||||||||
| Net income |
$ | 491,179 | $ | 498,660 | $ | 626,827 | $ | 592,887 | $ | 538,454 | ||||||||||
| Loans Held for Investment |
$ | 67,382,004 | $ | 69,723,169 | $ | 66,687,232 | $ | 66,539,623 | $ | 65,369,362 | ||||||||||
| Average Loans Held for Investment |
$ | 68,544,190 | $ | 67,727,632 | $ | 66,472,124 | $ | 65,639,360 | $ | 67,258,715 | ||||||||||
| Loans Held for Investment Yield |
14.20 | % | 15.05 | % | 14.56 | % | 13.49 | % | 13.23 | % | ||||||||||
| Net Interest Margin |
10.18 | % | 10.44 | % | 9.75 | % | 8.75 | % | 8.61 | % | ||||||||||
| Revenue Margin |
16.42 | % | 17.31 | % | 16.42 | % | 14.67 | % | 13.92 | % | ||||||||||
| Risk Adjusted Margin |
10.58 | % | 12.47 | % | 12.56 | % | 11.11 | % | 10.20 | % | ||||||||||
| Non-Interest Expenses as a % of Average Loans Held for Investment |
5.48 | % | 5.76 | % | 5.81 | % | 5.88 | % | 6.11 | % | ||||||||||
| Efficiency Ratio |
33.36 | % | 33.29 | % | 35.38 | % | 40.10 | % | 43.90 | % | ||||||||||
| Net charge-off rate |
5.85 | % | 4.84 | % | 3.85 | % | 3.56 | %(9) | 3.72 | % | ||||||||||
| Delinquency Rate (30+ days) |
4.04 | % | 4.28 | % | 3.80 | % | 2.98 | % | 3.06 | % | ||||||||||
| Purchase Volume (8) |
$ | 24,543,082 | $ | 28,230,725 | $ | 26,628,978 | $ | 26,940,397 | $ | 24,075,372 | ||||||||||
| Number of Loan Accounts (000s) |
40,611 | 41,044 | 41,081 | 41,174 | 41,318 | |||||||||||||||
| Auto Finance: |
||||||||||||||||||||
| Interest Income |
$ | 690,919 | $ | 687,389 | $ | 661,471 | $ | 651,821 | $ | 637,609 | ||||||||||
| Interest Expense |
289,357 | 300,133 | 283,949 | 277,783 | 265,556 | |||||||||||||||
| Net interest income |
$ | 401,562 | $ | 387,256 | $ | 377,522 | $ | 374,038 | $ | 372,053 | ||||||||||
| Non-interest income |
16,110 | 14,888 | 13,514 | 23,273 | 60,586 | |||||||||||||||
| Provision for loan losses |
408,251 | 429,247 | 244,537 | 182,278 | 200,058 | |||||||||||||||
| Non-interest expenses |
136,169 | 144,301 | 152,275 | 157,044 | 164,948 | |||||||||||||||
| Income tax (benefit) provision |
(44,362 | ) | (58,963 | ) | (1,987 | ) | 19,948 | 23,266 | ||||||||||||
| Net (loss) income |
$ | (82,386 | ) | $ | (112,441 | ) | $ | (3,789 | ) | $ | 38,041 | $ | 44,367 | |||||||
| Loans Held for Investment |
$ | 24,633,665 | $ | 25,128,352 | $ | 24,335,242 | $ | 24,067,760 | $ | 23,930,547 | ||||||||||
| Average Loans Held for Investment |
$ | 25,047,501 | $ | 24,920,380 | $ | 24,170,047 | $ | 23,898,070 | $ | 23,597,675 | ||||||||||
| Loans Held for Investment Yield |
11.03 | % | 11.03 | % | 10.95 | % | 10.91 | % | 10.81 | % | ||||||||||
| Net Interest Margin |
6.41 | % | 6.22 | % | 6.25 | % | 6.26 | % | 6.31 | % | ||||||||||
| Revenue Margin |
6.67 | % | 6.45 | % | 6.47 | % | 6.65 | % | 7.33 | % | ||||||||||
| Risk Adjusted Margin |
2.69 | % | 2.46 | % | 2.91 | % | 4.30 | % | 5.04 | % | ||||||||||
| Non-Interest Expenses as a % of Average Loans Held for Investment |
2.17 | % | 2.32 | % | 2.52 | % | 2.63 | % | 2.80 | % | ||||||||||
| Efficiency Ratio |
32.60 | % | 35.88 | % | 38.94 | % | 39.53 | % | 38.13 | % | ||||||||||
| Net charge-off rate |
3.98 | % | 4.00 | % | 3.56 | % | 2.35 | % | 2.29 | % | ||||||||||
| Delinquency Rate (30+ days) |
6.42 | % | 7.84 | % | 7.15 | % | 6.00 | % | 4.64 | % | ||||||||||
| Auto Loan Originations |
$ | 2,440,227 | $ | 3,623,491 | $ | 3,248,747 | $ | 2,992,427 | $ | 3,311,868 | ||||||||||
| Number of Loan Accounts (000s) |
1,763 | 1,771 | 1,731 | 1,771 | 1,762 | |||||||||||||||
| International: |
||||||||||||||||||||
| Interest Income |
$ | 405,433 | $ | 434,086 | $ | 423,658 | $ | 387,219 | $ | 385,078 | ||||||||||
| Interest Expense |
142,126 | 150,860 | 145,838 | 136,846 | 138,049 | |||||||||||||||
| Net interest income |
$ | 263,307 | $ | 283,226 | $ | 277,820 | $ | 250,373 | $ | 247,029 | ||||||||||
| Non-interest income |
139,173 | 191,972 | 153,373 | 138,151 | 138,812 | |||||||||||||||
| Provision for loan losses |
148,944 | 152,611 | 144,140 | 148,492 | 157,107 | |||||||||||||||
| Non-interest expenses |
204,142 | 241,290 | 216,062 | 211,356 | 198,354 | |||||||||||||||
| Income tax provision |
16,084 | 26,555 | 23,562 | 10,471 | 10,853 | |||||||||||||||
| Net income |
$ | 33,310 | $ | 54,742 | $ | 47,429 | $ | 18,205 | $ | 19,527 | ||||||||||
| Loans Held for Investment |
$ | 10,987,733 | $ | 11,656,922 | $ | 11,533,797 | $ | 10,982,656 | $ | 11,071,623 | ||||||||||
| Average Loans Held for Investment |
$ | 11,381,942 | $ | 11,673,473 | $ | 11,163,413 | $ | 10,982,708 | $ | 11,420,191 | ||||||||||
| Loans Held for Investment Yield |
14.25 | % | 14.87 | % | 15.18 | % | 14.10 | % | 13.49 | % | ||||||||||
| Net Interest Margin |
9.25 | % | 9.70 | % | 9.95 | % | 9.12 | % | 8.65 | % | ||||||||||
| Revenue Margin |
14.14 | % | 16.28 | % | 15.45 | % | 14.15 | % | 13.51 | % | ||||||||||
| Risk Adjusted Margin |
8.84 | % | 10.67 | % | 10.00 | % | 8.77 | % | 7.47 | % | ||||||||||
| Non-Interest Expenses as a % of Average Loans Held for Investment |
7.17 | % | 8.27 | % | 7.74 | % | 7.70 | % | 6.95 | % | ||||||||||
| Efficiency Ratio |
50.72 | % | 50.78 | % | 50.11 | % | 54.40 | % | 51.41 | % | ||||||||||
| Net charge-off rate |
5.30 | % | 5.61 | % | 5.45 | % | 5.39 | % | 6.04 | % | ||||||||||
| Delinquency Rate (30+ days) |
5.12 | % | 4.79 | % | 4.69 | % | 4.82 | % | 4.78 | % | ||||||||||
| Purchase Volume (8) |
$ | 2,716,060 | $ | 2,966,350 | $ | 2,369,696 | $ | 2,094,280 | $ | 1,874,981 | ||||||||||
| Number of Loan Accounts (000s) |
5,691 | 5,722 | 5,661 | 5,591 | 5,587 | |||||||||||||||
5
CAPITAL ONE FINANCIAL CORPORATION (COF)
SEGMENT AND NATIONAL LENDING SUBSEGMENT
FINANCIAL & STATISTICAL SUMMARY FOR CONTINUING OPERATIONS NOTES
| (1) | The information in this statistical summary reflects the adjustment to add back the effect of securitization transactions qualifying as sales under generally accepted accounting principles. See accompanying schedule—“Reconciliation to GAAP Financial Measures.” In Q3 2007, the Company shutdown the mortgage origination operations of its wholesale mortgage banking unit, GreenPoint Mortgage. The results of the mortgage origination operation of GreenPoint have been accounted for as a discontinued operation and have been removed from the Company’s results of continuing operations for all periods presented. The results of GreenPoint’s mortgage servicing business are reported in continuing operations for all periods presented. Effective Q4 2007, GreenPoint’s held for investment commercial and consumer loan portfolio results are included in continuing operations. |
| (2) | Includes domestic non-interest bearing deposits, NOW accounts, money market deposit accounts, savings accounts, certificates of deposit of less than $100,000 and other consumer time deposits. |
| (3) | Net Interest Margin—Loans equals interest income earned on loans divided by average managed loans. |
| (4) | Net Interest Margin—Deposits equals interest expense incurred on deposits divided by average retail deposits. |
| (5) | Net charge-off rate for Q2 2007 was positively impacted by 16 basis points due to the implementation of a change in customer statement generation from 30 to 25 days grace. This change did not have a material impact on the provision for the quarter. |
| (6) | Efficiency Ratio equals non-interest expenses divided by total managed revenue. |
| (7) | Certain prior period amounts have been reclassified to conform with current period presentation. |
| (8) | Includes all purchase transactions net of returns and excludes cash advance transactions. |
| (9) | Net charge-off rate for Q2 2007 was positively impacted by 31 basis points due to the implementation of a change in customer statement generation from 30 to 25 days grace. This change did not have a material impact on the provision for the quarter. |
| (10) | In Q1 2008 the Company reorganized its National Lending subsegments from U.S. Card, Auto Finance and Global Financial Services to U.S. Card and Other National Lending. The U.S. Card subsegment contains the results of the Company’s domestic credit card business, small business lending and the installment loan business. The Other National Lending subsegment contains the results of the Company’s auto finance business and the Company’s international lending businesses. Components of the Other National Lending subsegment are separately disclosed. Segment and subsegment results have been restated for all periods presented. |
6
CAPITAL ONE FINANCIAL CORPORATION (COF)
U.S. CARD SUBSEGMENT
MONTHLY CHARGE-OFF AND DELINQUENCY STATISTICS (1)
| (in thousands) |
March 2008 | February 2008 | January 2008 | |||||||||
| US Card: |
||||||||||||
| Net Principal Charge-Offs |
$ | 342,098 | $ | 314,455 | $ | 345,673 | ||||||
| Average Loans Held for Investment |
$ | 67,585,454 | $ | 68,635,480 | $ | 69,407,764 | ||||||
| Annualized Net Charge-Off Rate |
6.07 | % | 5.50 | % | 5.98 | % | ||||||
| 30 Days + Delinquencies |
$ | 2,723,515 | $ | 2,871,007 | $ | 3,009,706 | ||||||
| Period-end Loans Held for Investment |
$ | 67,382,681 | $ | 68,247,741 | $ | 69,080,666 | ||||||
| 30 Days + Delinquency Rate |
4.04 | % | 4.21 | % | 4.36 | % | ||||||
| (1) | In connection with the National Lending subsegment reorganization in Q1 2008 the Company is restating the monthly charge-off and delinquency statistics for U.S. Card. The restated U.S. Card subsegment contains the results of the Company’s domestic credit card business, small business lending and the installment loan business. |
7
CAPITAL ONE FINANCIAL CORPORATION
Reconciliation to GAAP Financial Measures
For the Three Months Ended March 31, 2008
(dollars in thousands)(unaudited)
The Company’s consolidated financial statements prepared in accordance with generally accepted accounting principles (“GAAP”) are referred to as its “reported” financial statements. Loans included in securitization transactions which qualified as sales under GAAP have been removed from the Company’s “reported” balance sheet. However, servicing fees, finance charges, and other fees, net of charge-offs, and interest paid to investors of securitizations are recognized as servicing and securitizations income on the “reported” income statement.
The Company’s “managed” consolidated financial statements reflect adjustments made related to effects of securitization transactions qualifying as sales under GAAP. The Company generates earnings from its “managed” loan portfolio which includes both the on-balance sheet loans and off-balance sheet loans. The Company’s “managed” income statement takes the components of the servicing and securitizations income generated from the securitized portfolio and distributes the revenue and expense to appropriate income statement line items from which it originated. For this reason the Company believes the “managed” consolidated financial statements and related managed metrics to be useful to stakeholders.
| Total Reported | Adjustments(1) | Total Managed(2) | ||||||||
| Income Statement Measures(3) |
||||||||||
| Net interest income |
$ | 1,811,917 | $ | 1,164,933 | $ | 2,976,850 | ||||
| Non-interest income |
2,056,478 | (449,793 | ) | 1,606,685 | ||||||
| Total revenue |
3,868,395 | 715,140 | 4,583,535 | |||||||
| Provision for loan losses |
1,079,072 | 715,140 | 1,794,212 | |||||||
| Net charge-offs |
$ | 767,134 | $ | 715,140 | $ | 1,482,274 | ||||
| Balance Sheet Measures |
||||||||||
| Loans held for investment |
$ | 98,356,088 | $ | 49,680,440 | $ | 148,036,528 | ||||
| Total assets |
$ | 150,608,527 | $ | 48,933,606 | $ | 199,542,133 | ||||
| Average loans held for investment |
$ | 99,818,867 | $ | 49,900,631 | $ | 149,719,498 | ||||
| Average earning assets |
$ | 127,867,951 | $ | 47,888,798 | $ | 175,756,749 | ||||
| Average total assets |
$ | 151,294,899 | $ | 49,055,552 | $ | 200,350,451 | ||||
| Delinquencies |
$ | 3,206,724 | $ | 2,061,963 | $ | 5,268,687 | ||||
| (1) |
Income statement adjustments reclassify the net of finance charges of $1,524.0 million, past-due fees of $263.5 million, other interest income of $(38.8) million and interest expense of $583.8 million; and net charge-offs of $715.1 million from non-interest income to net interest income and provision for loan losses, respectively. |
| (2) |
The managed loan portfolio does not include auto loans which have been sold in whole loan sale transactions where the Company has retained servicing rights. |
| (3) |
Based on continuing operations. |
8
CAPITAL ONE FINANCIAL CORPORATION
Consolidated Balance Sheets
(in thousands)(unaudited)
| As of March 31 2008 |
As of December 31 2007 |
As of March 31 2007 |
||||||||||
| Assets: |
||||||||||||
| Cash and due from banks |
$ | 2,324,079 | $ | 2,377,287 | $ | 2,286,913 | ||||||
| Federal funds sold and resale agreements |
1,842,775 | 1,766,762 | 8,293,338 | |||||||||
| Interest-bearing deposits at other banks |
663,150 | 677,360 | 844,907 | |||||||||
| Cash and cash equivalents |
4,830,004 | 4,821,409 | 11,425,158 | |||||||||
| Securities available for sale |
22,190,739 | 19,781,587 | 17,657,734 | |||||||||
| Mortgage loans held for sale |
192,584 | 315,863 | 4,738,765 | |||||||||
| Loans held for investment |
98,356,088 | 101,805,027 | 90,869,496 | |||||||||
| Less: Allowance for loan and lease losses |
(3,273,355 | ) | (2,963,000 | ) | (2,105,000 | ) | ||||||
| Net loans held for investment |
95,082,733 | 98,842,027 | 88,764,496 | |||||||||
| Accounts receivable from securitizations |
5,396,943 | 4,717,879 | 5,371,385 | |||||||||
| Premises and equipment, net |
2,316,233 | 2,299,603 | 2,258,861 | |||||||||
| Interest receivable |
750,319 | 839,317 | 720,511 | |||||||||
| Goodwill |
12,826,419 | 12,830,740 | 13,619,445 | |||||||||
| Other |
7,022,553 | 6,141,944 | 4,142,250 | |||||||||
| Total assets |
$ | 150,608,527 | $ | 150,590,369 | $ | 148,698,605 | ||||||
| Liabilities: |
||||||||||||
| Non-interest-bearing deposits |
$ | 11,071,116 | $ | 11,046,549 | $ | 11,357,736 | ||||||
| Interest-bearing deposits |
76,623,826 | 71,714,627 | 76,112,874 | |||||||||
| Senior and subordinated notes |
9,834,392 | 10,712,706 | 9,436,021 | |||||||||
| Other borrowings |
21,673,670 | 26,812,969 | 20,437,982 | |||||||||
| Interest payable |
509,278 | 631,609 | 540,160 | |||||||||
| Other |
6,276,718 | 5,377,797 | 4,793,062 | |||||||||
| Total liabilities |
125,989,000 | 126,296,257 | 122,677,835 | |||||||||
| Stockholders’ Equity: |
||||||||||||
| Common stock |
4,213 | 4,192 | 4,146 | |||||||||
| Paid-in capital, net |
15,918,230 | 15,860,490 | 15,465,341 | |||||||||
| Retained earnings and cumulative other comprehensive income |
11,860,288 | 11,582,816 | 10,684,768 | |||||||||
| Less: Treasury stock, at cost |
(3,163,204 | ) | (3,153,386 | ) | (133,485 | ) | ||||||
| Total stockholders’ equity |
24,619,527 | 24,294,112 | 26,020,770 | |||||||||
| Total liabilities and stockholders’ equity |
$ | 150,608,527 | $ | 150,590,369 | $ | 148,698,605 | ||||||
9
CAPITAL ONE FINANCIAL CORPORATION
Consolidated Statements of Income
(in thousands, except per share data)(unaudited)
| Three Months Ended | ||||||||||||
| March 31 2008 |
December 31 2007 |
March 31(1) 2007 |
||||||||||
| Interest Income: |
||||||||||||
| Loans held for investment, including past-due fees |
$ | 2,507,724 | $ | 2,536,779 | $ | 2,326,680 | ||||||
| Securities available for sale |
257,747 | 256,364 | 204,080 | |||||||||
| Other |
114,054 | 167,051 | 181,549 | |||||||||
| Total interest income |
2,879,525 | 2,960,194 | 2,712,309 | |||||||||
| Interest Expense: |
||||||||||||
| Deposits |
610,389 | 686,174 | 730,483 | |||||||||
| Senior and subordinated notes |
140,970 | 159,878 | 138,546 | |||||||||
| Other borrowings |
316,249 | 351,895 | 238,737 | |||||||||
| Total interest expense |
1,067,608 | 1,197,947 | 1,107,766 | |||||||||
| Net interest income |
1,811,917 | 1,762,247 | 1,604,543 | |||||||||
| Provision for loan and lease losses |
1,079,072 | 1,294,210 | 350,045 | |||||||||
| Net interest income after provision for loan and lease losses |
732,845 | 468,037 | 1,254,498 | |||||||||
| Non-Interest Income: |
||||||||||||
| Servicing and securitizations |
1,083,062 | 1,271,396 | 988,082 | |||||||||
| Service charges and other customer-related fees |
574,061 | 573,034 | 479,467 | |||||||||
| Mortgage servicing and other |
35,255 | (5,700 | ) | 51,450 | ||||||||
| Interchange |
151,902 | 152,595 | 118,111 | |||||||||
| Other |
212,198 | 167,015 | 137,260 | |||||||||
| Total non-interest income |
2,056,478 | 2,158,340 | 1,774,370 | |||||||||
| Non-Interest Expense: |
||||||||||||
| Salaries and associate benefits |
611,280 | 622,101 | 675,171 | |||||||||
| Marketing |
297,793 | 358,182 | 330,894 | |||||||||
| Communications and data processing |
187,243 | 189,415 | 182,234 | |||||||||
| Supplies and equipment |
130,931 | 146,267 | 133,898 | |||||||||
| Occupancy |
88,080 | 91,675 | 77,395 | |||||||||
| Restructuring expense |
52,759 | 27,809 | — | |||||||||
| Other |
454,191 | 699,758 | 574,455 | |||||||||
| Total non-interest expense |
1,822,277 | 2,135,207 | 1,974,047 | |||||||||
| Income from continuing operations before income taxes |
967,046 | 491,170 | 1,054,821 | |||||||||
| Income taxes |
334,491 | 169,558 | 368,697 | |||||||||
| Income from continuing operations, net of tax |
632,555 | 321,612 | 686,124 | |||||||||
| Loss from discontinued operations, net of tax(2) |
(84,051 | ) | (95,044 | ) | (11,074 | ) | ||||||
| Net income |
$ | 548,504 | $ | 226,568 | $ | 675,050 | ||||||
| Basic earnings per share |
||||||||||||
| Income from continuing operations |
$ | 1.71 | $ | 0.85 | $ | 1.68 | ||||||
| Loss from discontinued operations |
(0.23 | ) | (0.25 | ) | (0.03 | ) | ||||||
| Net income |
$ | 1.48 | $ | 0.60 | $ | 1.65 | ||||||
| Diluted earnings per share |
||||||||||||
| Income from continuing operations |
$ | 1.70 | $ | 0.85 | $ | 1.65 | ||||||
| Loss from discontinued operations |
(0.23) | (0.25) | (0.03) | |||||||||
| Net income |
$ | 1.47 | $ | 0.60 | $ | 1.62 | ||||||
| Dividends paid per share |
$ | 0.375 | $ | 0.03 | $ | 0.03 | ||||||
| (1) | Certain prior period amounts have been reclassified to conform to the current period presentation. |
| (2) | In Q3 2007, the Company shutdown the mortgage origination operations of its wholesale mortgage banking unit, GreenPoint Mortgage. The results of the mortgage origination operation of GreenPoint have been accounted for as a discontinued operation and have been removed from the Company’s results of continuing operations for all periods presented. |
10
CAPITAL ONE FINANCIAL CORPORATION
Statements of Average Balances, Income and Expense, Yields and Rates
(dollars in thousands)(unaudited)
| Reported | Quarter Ended 3/31/08 | Quarter Ended 12/31/07(1) | Quarter Ended 3/31/07 (1) | ||||||||||||||||||||||||
| Average Balance |
Income/ Expense |
Yield/ Rate |
Average Balance |
Income/ Expense |
Yield/ Rate |
Average Balance |
Income/ Expense |
Yield/ Rate |
|||||||||||||||||||
| Earning assets: |
|||||||||||||||||||||||||||
| Loans held for investment |
$ | 99,818,867 | $ | 2,507,724 | 10.05 | % | $ | 97,784,813 | $ | 2,536,779 | 10.38 | % | $ | 93,465,873 | $ | 2,326,680 | 9.96 | % | |||||||||
| Securities available for sale |
21,211,356 | 257,747 | 4.86 | % | 20,102,440 | 256,364 | 5.10 | % | 16,598,686 | 204,080 | 4.92 | % | |||||||||||||||
| Other |
6,789,537 | 114,054 | 6.72 | % | 9,355,161 | 167,051 | 7.14 | % | 10,701,814 | 181,549 | 6.79 | % | |||||||||||||||
| Total earning assets (2) |
$ | 127,819,760 | $ | 2,879,525 | 9.01 | % | $ | 127,242,414 | $ | 2,960,194 | 9.31 | % | $ | 120,766,373 | $ | 2,712,309 | 8.98 | % | |||||||||
| Interest-bearing liabilities: |
|||||||||||||||||||||||||||
| Interest-bearing deposits |
|||||||||||||||||||||||||||
| NOW accounts |
$ | 3,958,482 | $ | 17,714 | 1.79 | % | $ | 4,674,490 | $ | 30,443 | 2.61 | % | $ | 5,066,120 | $ | 35,414 | 2.80 | % | |||||||||
| Money market deposit accounts |
29,636,896 | 211,436 | 2.85 | % | 28,745,701 | 270,943 | 3.77 | % | 25,273,763 | 249,654 | 3.95 | % | |||||||||||||||
| Savings accounts |
8,064,412 | 24,008 | 1.19 | % | 8,172,510 | 32,520 | 1.59 | % | 8,384,994 | 35,529 | 1.69 | % | |||||||||||||||
| Other Consumer Time Deposits |
18,429,463 | 204,942 | 4.45 | % | 16,374,958 | 183,570 | 4.48 | % | 19,599,576 | 213,051 | 4.35 | % | |||||||||||||||
| Public Fund CD’s of $100,000 or more |
1,671,936 | 15,718 | 3.76 | % | 1,902,442 | 23,126 | 4.86 | % | 2,038,785 | 24,897 | 4.88 | % | |||||||||||||||
| CD’s of $100,000 or more |
8,756,978 | 99,264 | 4.53 | % | 8,335,941 | 97,335 | 4.67 | % | 10,339,958 | 122,618 | 4.74 | % | |||||||||||||||
| Foreign time deposits |
3,648,797 | 37,307 | 4.09 | % | 3,868,444 | 48,237 | 4.99 | % | 3,950,808 | 49,320 | 4.99 | % | |||||||||||||||
| Total Interest-bearing deposits |
$ | 74,166,964 | $ | 610,389 | 3.29 | % | $ | 72,074,486 | $ | 686,174 | 3.81 | % | $ | 74,654,004 | $ | 730,483 | 3.91 | % | |||||||||
| Senior and subordinated notes |
10,099,878 | 140,970 | 5.58 | % | 10,682,635 | 159,878 | 5.99 | % | 9,517,209 | 138,546 | 5.82 | % | |||||||||||||||
| Other borrowings |
25,449,240 | 316,249 | 4.97 | % | 26,671,101 | 351,895 | 5.28 | % | 17,908,044 | 238,737 | 5.33 | % | |||||||||||||||
| Total interest-bearing liabilities(2) |
$ | 109,716,082 | $ | 1,067,608 | 3.89 | % | $ | 109,428,222 | $ | 1,197,947 | 4.38 | % | $ | 102,079,257 | $ | 1,107,766 | 4.34 | % | |||||||||
| Net interest spread |
5.12 | % | 4.93 | % | 4.64 | % | |||||||||||||||||||||
| Interest income to average earning assets |
9.01 | % | 9.31 | % | 8.98 | % | |||||||||||||||||||||
| Interest expense to average earning assets |
3.34 | % | 3.77 | % | 3.67 | % | |||||||||||||||||||||
| Net interest margin |
5.67 | % | 5.54 | % | 5.31 | % | |||||||||||||||||||||
| (1) | Prior period amounts have been reclassified to conform with current period presentation. |
| (2) | Average balances, income and expenses, yields and rates are based on continuing operations. |
11
CAPITAL ONE FINANCIAL CORPORATION
Statements of Average Balances, Income and Expense, Yields and Rates
(dollars in thousands)(unaudited)
| Managed (1) | Quarter Ended 3/31/08 | Quarter Ended 12/31/07(2) | Quarter Ended 3/31/07 (2) | ||||||||||||||||||||||||
| Average Balance |
Income/ Expense |
Yield/ Rate |
Average Balance |
Income/ Expense |
Yield/ Rate |
Average Balance |
Income/ Expense |
Yield/ Rate |
|||||||||||||||||||
| Earning assets: |
|||||||||||||||||||||||||||
| Loans held for investment |
$ | 149,719,498 | $ | 4,315,625 | 11.53 | % | $ | 148,362,338 | $ | 4,512,219 | 12.17 | % | $ | 144,112,789 | $ | 4,035,997 | 11.20 | % | |||||||||
| Securities available for sale |
21,211,356 | 257,747 | 4.86 | % | 20,102,440 | 256,364 | 5.10 | % | 16,598,686 | 204,080 | 4.92 | % | |||||||||||||||
| Other |
4,777,704 | 54,884 | 4.60 | % | 7,186,892 | 94,663 | 5.27 | % | 8,646,251 | 119,586 | 5.53 | % | |||||||||||||||
| Total earning assets (3) |
$ | 175,708,558 | $ | 4,628,256 | 10.54 | % | $ | 175,651,670 | $ | 4,863,246 | 11.07 | % | $ | 169,357,726 | $ | 4,359,663 | 10.30 | % | |||||||||
| Interest-bearing liabilities: |
|||||||||||||||||||||||||||
| Interest-bearing deposits |
|||||||||||||||||||||||||||
| NOW accounts |
$ | 3,958,482 | $ | 17,714 | 1.79 | % | $ | 4,674,490 | $ | 30,443 | 2.61 | % | $ | 5,066,120 | $ | 35,414 | 2.80 | % | |||||||||
| Money market deposit accounts |
29,636,896 | 211,436 | 2.85 | % | 28,745,701 | 270,943 | 3.77 | % | 25,273,763 | 249,654 | 3.95 | % | |||||||||||||||
| Savings accounts |
8,064,412 | 24,008 | 1.19 | % | 8,172,510 | 32,520 | 1.59 | % | 8,384,994 | 35,529 | 1.69 | % | |||||||||||||||
| Other Consumer Time Deposits |
18,429,463 | 204,942 | 4.45 | % | 16,374,958 | 183,570 | 4.48 | % | 19,599,576 | 213,051 | 4.35 | % | |||||||||||||||
| Public Fund CD’s of $100,000 or more |
1,671,936 | 15,718 | 3.76 | % | 1,902,442 | 23,126 | 4.86 | % | 2,038,785 | 24,897 | 4.88 | % | |||||||||||||||
| CD’s of $100,000 or more |
8,756,978 | 99,264 | 4.53 | % | 8,335,941 | 97,335 | 4.67 | % | 10,339,958 | 122,618 | 4.74 | % | |||||||||||||||
| Foreign time deposits |
3,648,797 | 37,307 | 4.09 | % | 3,868,444 | 48,237 | 4.99 | % | 3,950,808 | 49,320 | 4.99 | % | |||||||||||||||
| Total Interest-bearing deposits |
$ | 74,166,964 | $ | 610,389 | 3.29 | % | $ | 72,074,486 | $ | 686,174 | 3.81 | % | $ | 74,654,004 | $ | 730,483 | 3.91 | % | |||||||||
| Senior and subordinated notes |
10,099,878 | 140,970 | 5.58 | % | 10,682,635 | 159,878 | 5.99 | % | 9,517,209 | 138,546 | 5.82 | % | |||||||||||||||
| Other borrowings |
25,449,240 | 316,249 | 4.97 | % | 26,671,101 | 351,895 | 5.28 | % | 17,908,044 | 238,737 | 5.33 | % | |||||||||||||||
| Securitization liability |
49,270,231 | 583,798 | 4.74 | % | 49,847,555 | 664,786 | 5.33 | % | 49,999,873 | 649,443 | 5.20 | % | |||||||||||||||
| Total interest-bearing liabilities(3) |
$ | 158,986,313 | $ | 1,651,406 | 4.15 | % | $ | 159,275,777 | $ | 1,862,733 | 4.68 | % | $ | 152,079,130 | $ | 1,757,209 | 4.62 | % | |||||||||
| Net interest spread |
6.39 | % | 6.39 | % | 5.68 | % | |||||||||||||||||||||
| Interest income to average earning assets |
10.54 | % | 11.07 | % | 10.30 | % | |||||||||||||||||||||
| Interest expense to average earning assets |
3.76 | % | 4.24 | % | 4.15 | % | |||||||||||||||||||||
| Net interest margin |
6.78 | % | 6.83 | % | 6.15 | % | |||||||||||||||||||||
| (1) | The information in this table reflects the adjustment to add back the effect of securitized loans. |
| (2) | Prior period amounts have been reclassified to conform with current period presentation. |
| (3) | Average balances, income and expenses, yields and rates are based on continuing operations. |
12

1680 Capital One Drive, McLean, VA 22102
Press Release
FOR IMMEDIATE RELEASE: April 17, 2008
| Contacts: | Investor Relations | Media Relations | ||||
| Jeff Norris | Tatiana Stead | Julie Rakes | ||||
| 703.720.2455 | 703.720.2352 | 804.284.5800 | ||||
Capital One Reports First Quarter Earnings per Share (diluted) of $1.47
Diluted earning per share from continuing operations of $1.70 increased 2.9%
McLean, Va. (April 17, 2008) – Capital One Financial Corporation (NYSE: COF) today announced earnings for the first quarter of 2008 of $548.5 million, or $1.47 per share (diluted). Earnings from continuing operations in the first quarter of 2008 were $632.6 million, or $1.70 per share (diluted). In the first quarter of 2007, the company reported earnings of $675.0 million, or $1.62 per share (diluted), and earnings from continuing operations of $686.1 million, or $1.65 per share (diluted). Earnings from continuing operations exclude the loss from discontinued operations related to the shutdown of GreenPoint Mortgage.
“In March, we completed a major milestone of our banking integration and launched the Capital One Bank brand in the New York region, marking the completion of our transformation into a diversified bank,” said Richard D. Fairbank, Capital One’s Chairman and Chief Executive Officer. “We’re well positioned to navigate near-term cyclical challenges with resilient businesses, experience in managing through prior cyclical downturns, and a strong balance sheet. We’re actively managing the company to protect our franchises and deliver shareholder returns.”
Highlights of the quarter:
| • | Results include a $200 million benefit related to the VISA initial public offering, a $310 million addition to the company’s allowance for loan losses, and a $104 million increase to the GreenPoint Mortgage rep and warranty reserve. |
| • | Credit performance was largely in line with expectations; but outlook significantly deteriorated due to weakness in U.S. economy. |
| • | Managed loans declined $3.3 billion; deposits grew $4.9 billion |
| • | Ratio of tangible common equity (TCE) to tangible managed assets increased from 5.83 percent to 6.03 percent. |
| • | Increased the quarterly dividend per share from $0.027 to $0.375 |
| • | Completed integration of multiple systems, including deposit platform, and New York metro bank brand conversion. |
“A substantial increase in revenue margin coupled with expense reductions largely offset the adverse impact of higher credit costs,” said Gary L. Perlin, Capital One’s Chief Financial Officer. “Because of the strong capital generation of our businesses, we were able to significantly raise our dividend as planned, while building capital to the high end of our range.”
Total Company Results
| • | Total deposits of $87.7 billion at March 31, 2008 were up $4.9 billion, or 6.0 percent, from December 31, 2007 and $224.3 million, or essentially flat relative to March 31, 2007. |
| • | Managed loans held for investment of $148.0 billion decreased from the fourth quarter of 2007 by $3.3 billion, or 2.2 percent, but increased from the year ago quarter by $6.0 billion, or 4.2 percent. |
| • | Managed revenue margin of 10.43 percent in the first quarter of 2008 was relatively flat compared to 10.40 percent in the fourth quarter of 2007, but up 123 basis points from 9.20 percent in the first quarter of 2007. |
| • | Managed provision expense was $1.8 billion. The company added $310.4 million to its allowance in the first quarter of 2008. This allowance build is consistent with expected managed losses of $6.7 billion over the next 12 months, ending March 31, 2009. |
| • | Operating expenses declined $277.5 million relative to the fourth quarter of 2007. The managed efficiency ratio for the first quarter of 2008 was 38.61 percent, down from 46.15 percent in the fourth quarter of 2007. Looking forward, the company expects its operating efficiency ratio to be in the mid-forty percent range or lower for the full year 2008. |
Segment Results
Local Banking Segment highlights
The Local Banking business posted modest loan and deposit growth while successfully completing a major platform integration in the quarter. Profits declined, mostly as a result of higher provision expense as the economy weakened. The successful integration of multiple systems, including the deposit platform, and the launch of the Capital One Bank brand in the New York area provide the foundations that will enable the Local Banking business to develop new growth strategies and continue the tradition of providing excellent customer service to banking customers across the franchise.
| • | Net income of $75.8 million was down $27.8 million from $103.6 million in the fourth quarter of 2007. |
| • | Loans held for investment were up $224.3 million relative to the fourth quarter of 2007 to $44.2 billion. |
| • | Total Bank deposits increased $297.9 million from the fourth quarter of 2007 to $73.4 billion. |
| • | Net charge-off rate of 31 basis points and non-performing loans as a percent of loans held for investment of 56 basis points increased from 28 basis points and 41 basis points in the fourth quarter of 2007, respectively. |
National Lending Segment
In the first quarter of 2008 the company reorganized its National Lending subsegments from U.S. Card, Auto Finance and Global Financial Services to U.S. Card and Other National Lending. The U.S. Card subsegment contains the results of the company’s domestic credit card business, as well as small business lending and the installment loan business, which were previously in Global Financial Services. The Other National Lending subsegment contains the results of the company’s auto finance business, and the company’s international lending businesses, which were previously in Global Financial Services. Components of the Other National Lending subsegment are separately disclosed. Segment and subsegment results have been restated for all periods presented.
| • | Profits for the National Lending segment were flat as compared to the fourth quarter of 2007, and down 26.6 percent relative to the first quarter of 2007. |
| • | The managed charge-off rate for the National Lending segment increased 61 basis points to 5.34 percent in the first quarter of 2008 from 4.73 percent in the fourth quarter of 2007. |
| • | The delinquency rate of 4.73 percent in the first quarter of 2008 for the National Lending subsegment decreased from 5.17 percent as of December 31, 2007. |
U.S. Card highlights
Strong revenue growth and continuing expense reductions partially offset increasing provision expense, resulting in solid profits in the face of cyclical economic headwinds. The U.S. Card business remains well positioned to navigate near-term challenges and continue its profitability through the economic cycle.
| • | U.S. Card reported net income of $491.2 million, a 1.5 percent decrease relative to the fourth quarter of 2007 and an 8.8 percent decrease relative to the first quarter of 2007. |
| • | Total revenues decreased $117.2 million, or 4.0 percent, compared to the fourth quarter of 2007 but increased $474.1 million, or 20.3 percent, over the prior year’s same quarter. |
| • | Non-interest expenses declined 3.8 percent over the previous quarter and 8.6 percent relative to the first quarter of 2007. |
| • | Managed loans declined from the fourth quarter of 2007 by 3.4 percent, or $2.3 billion, to $67.4 billion at March 31, 2008, but increased 3.1 percent from the year ago quarter. |
| • | Charge-offs rose in the first quarter of 2008 to 5.85 percent from 4.84 percent in the fourth quarter of 2007, and from 3.72 percent in the first quarter of 2007. The company expects the charge-off rate to be in the low six percent range for the next six months for the new U.S. Card subsegment, but higher in the fourth quarter. |
| • | Delinquencies improved in the first quarter of 2008 to 4.04 percent from 4.28 percent in the previous quarter but rose from 3.06 percent in the year ago quarter. |
Auto Finance highlights
The Auto Finance business posted a net loss in the quarter as the company continued its significant pull back and repositioning of the business. The results of the Auto Finance business continue to be negatively impacted by both the current credit environment, and the company’s credit outlook. Origination volumes were reduced significantly as a result of tightening credit policy and increased pricing. The company expects its actions to result in a substantially smaller but more stable Auto Finance business going forward.
| • | Auto Finance posted a net loss of $82.4 million in the quarter, compared to a loss of $112.4 million last quarter. Total revenues increased $15.5 million and provision and operating expenses decreased by $29.1 million. |
| • | Net charge-offs of 3.98 percent declined slightly from 4.00 percent in the fourth quarter of 2007, but increased from 2.29 percent in the first quarter of 2007. Delinquencies declined 142 basis points from the prior quarter to 6.42 percent but rose from 4.64 percent in the year ago quarter. |
| • | Originations in the first quarter of $2.4 billion were down 32.7 percent, or $1.2 billion, compared to the prior quarter. |
| • | Managed loans of $24.6 billion as of March 31, 2008 were down 2.0 percent relative to the fourth quarter of 2007 but up 2.9 percent from the first quarter of 2007. |
International highlights
The Canadian credit card business continued to perform relatively well, with stable credit performance and solid returns. The company’s credit performance has been stable to modestly improving for several quarters, reflecting a more stable UK credit environment. However, the company remains cautious about growth in the UK, given growing economic uncertainty in that market.
| • | International’s net income of $33.3 million declined $21.4 million from the fourth quarter of 2007, but increased $13.8 million from $19.5 million in the year-ago quarter. |
| • | Charge-offs of 5.30 percent declined 31 basis points from 5.61 percent in the fourth quarter of 2007, and 74 basis points from 6.04 percent in the first quarter of 2007. |
| • | Delinquencies increased 33 basis points to 5.12 percent from 4.79 percent in the prior quarter and 34 basis points from 4.78 percent in the year ago quarter. |
The company generates earnings from its managed loan portfolio, which includes both on-balance sheet loans and securitized (off-balance sheet) loans. For this reason, the company believes managed financial measures to be useful to stakeholders. In compliance with Regulation G of the Securities and Exchange Commission, the company is providing a numerical reconciliation of managed financial measures to comparable measures calculated on a reported basis using generally accepted accounting principles (GAAP). Please see the schedule titled “Reconciliation to GAAP Financial Measures” attached to this release for more information.
Forward looking statements
The company cautions that its current expectations in this release, in the presentation slides available on the company’s website and in its Form 8-K dated April 17, 2008 for 2008 revenue growth, loan and deposit growth, return on equity, the projected charge-off rate and revenue margin in the U.S. Card subsegment for 2008, estimated loss levels for the 12 months ending March 31, 2009 underlying its provision expenses in the first quarter of 2008, credit performance and trends, operating efficiencies, operating expense reductions, and dividends, including future financial and operating results, and the company’s plans, objectives, expectations, and intentions, are forward-looking statements and actual results could differ materially from current expectations due to a number of factors, including: general economic conditions affecting interest rates and consumer income, spending, and savings which may affect consumer bankruptcies, defaults, charge-offs and deposit activity; changes in the labor and employment market; changes in the credit environment in the U.S. and/or the UK; the company’s ability to execute on its strategic and operational plans; the risk that the company’s acquired businesses will not be integrated successfully and that the cost savings and other synergies from such acquisitions may not be fully realized; continued intense competition from numerous providers of products and services which compete with Capital One’s businesses; changes in the company’s aggregate accounts and balances, and the growth rate and composition thereof; the risk that the benefits of the company’s restructuring initiative, including cost savings and other benefits, may not be fully realized; the success of the company’s marketing efforts; and general secondary market conditions in the mortgage industry. A discussion of these and other factors can be found in Capital One’s annual report and other reports filed with the Securities and Exchange Commission, including, but not limited to, Capital One’s report on Form 10-K for the fiscal year ended December 31, 2007.
About Capital One
Capital One Financial Corporation (www.capitalone.com) is a financial holding company whose subsidiaries collectively had $87.7 billion in deposits and $148.0 billion in managed loans outstanding as of March 31, 2008. Headquartered in McLean, VA, Capital One has 745 locations in New York, New Jersey, Connecticut, Texas and Louisiana. It is a diversified financial services company whose principal subsidiaries, Capital One, N.A., Capital One Bank (USA), N. A., and Capital One Auto Finance, Inc., offer a broad spectrum of financial products and services to consumers, small businesses and commercial clients. A Fortune 500 company, Capital One trades on the New York Stock Exchange under the symbol “COF” and is included in the S&P 100 index.
###
NOTE: First quarter 2008 financial results, SEC Filings, and first quarter earnings conference call slides are accessible on Capital One’s home page (www.capitalone.com). Choose “Investors” on the bottom of the home page to view and download the earnings press release, slides, and other financial information. Additionally, a podcast and webcast of today’s 5:00 pm (ET) earnings conference call is accessible through the same link.
 First quarter 2008
results April 17, 2008 Exhibit 99.2 * * * * * * * |
 2 Forward-Looking Information Please note that the following materials containing information regarding Capital One’s financial
performance speak only as of the particular date or dates indicated in these materials. Capital
One does not undertake any obligation to update or revise any of the information contained herein whether as a result of new information, future events or otherwise. Certain statements in this presentation and other oral and written statements made by the Company from time
to time, are forward-looking statements, including those that discuss strategies, goals,
outlook or other non-historical matters; projections, revenues, income, returns, earnings
per share or other financial measures for Capital One and/or discuss the assumptions that underlie these projections, including future financial and operating results, and the company’s plans, objectives, expectations and intentions. To the extent that any such information is forward-looking, it is intended to fit within the safe harbor for forward-looking information
provided by the Private Securities Litigation Reform Act of 1995. Numerous factors could cause
our actual results to differ materially from those described in forward-looking statements, including, among other things: general economic and business conditions in the U.S. and or the UK, including conditions affecting consumer income, spending and repayments, changes in the credit environment in the U.S. and or the UK, including an increase
or decrease in credit losses, changes in the interest rate environment; continued intense
competition from numerous providers of products and services that compete with our businesses;
financial, legal, regulatory or accounting changes or actions; changes in our aggregate accounts or consumer loan balances and the growth rate and composition thereof; the amount of deposit growth; changes in the reputation of the credit
card industry and/or the company with respect to practices and products; the risk that Capital
One’s acquired businesses will not be integrated successfully; the risk that synergies from such acquisitions may not be fully realized or may take longer to realize than expected; disruption from
the acquisitions making it more difficult to maintain relationships with customers, employees or suppliers; the risk that the benefits of the
Company’s restructuring initiative, including cost savings, may not be fully realized; our
ability to access the capital markets at attractive rates and terms to fund our operations and future growth; losses associated with new products or services; the company’s ability to execute on its strategic and
operational plans; any significant disruption in our operations or technology platform; our ability to effectively control our costs; the success of marketing efforts; our ability to recruit and retain experienced management personnel; changes in the labor and employment market; general economic conditions
in the mortgage industry; and other factors listed from time to time in reports we file with
the Securities and Exchange Commission (the “SEC”), including, but not limited to, factors set forth under the caption “Risk Factors” in our Annual Report on Form 10-K for the year ended December 31, 2007. You should carefully consider the factors discussed above in evaluating these forward-looking statements. All
information in these slides is based on the consolidated results of Capital One Financial
Corporation. A reconciliation of any non-GAAP financial measures included in this presentation can be found in the Company’s most recent Form 10-K concerning annual financial results, available on
the Company’s website at www.capitalone.com in Investor Relations under “About Capital One.” Forward looking statements |
| 3 • Diluted EPS of $1.47; EPS from Continuing Operations of $1.70, up 3% over Q107 – Allowance build of $310M – $104M increase to GreenPoint Rep and Warranty reserve – $200M benefit from Visa IPO • Substantial increase in revenue margin year-over-year, coupled with expense reductions, largely offset the adverse impact of higher credit costs • Credit performance largely in line with expectations, but credit outlook worsening due to weakening US economy • Remain cautious on loan growth; bullish on deposit growth – Managed loans declined $3.3B from Q407; deposits grew $4.9B • Balance sheet remains a source of strength – TCE ratio increased from 5.83% in Q407 to 6.03% – Maintained strong liquidity and diverse funding sources – Increased quarterly dividend to $0.375 • Completed integration of multiple systems, including deposit platform, and New York metro bank brand conversion First quarter 2008 highlights |
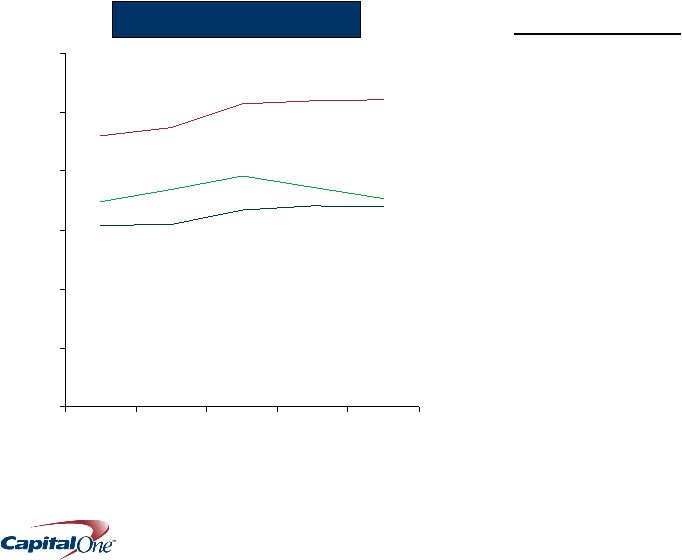 4 Substantial increase in revenue margin year-over-year largely offset the adverse impact of higher credit costs 10.43% 10.40% 9.20% 6.78% 6.83% 6.15% 7.06% 7.45% 6.97% 0% 2% 4% 6% 8% 10% 12% Q107 Q207 Q307 Q407 Q108 Margins Revenue Margin Net Interest Margin Margin Drivers • Year-over-year: US Card pricing and fee changes drove substantial increase in revenue margin • Quarter-over-quarter: Reduced US Card fees offset by more active balance sheet management Risk-Adjusted Margin |
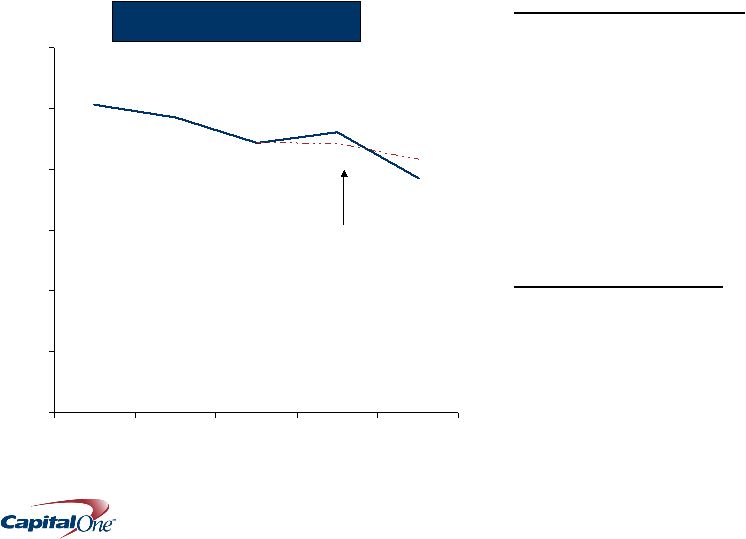 5 We continue to drive efficiency gains 38.6% 41.6% 46.2% 50.7% 44.2% 0% 10% 20% 30% 40% 50% 60% Q107 Q207 Q307 Q407 Q108 Efficiency Ratio Excluding Visa one-time impacts Quarterly Highlights • Reduced headcount by 1,600 in Q108; 5,400 since Q107 • Announced UK and Auto Finance restructurings – Approximately 1000 positions to be eliminated 2008 Expectations • Mid-40%’s or lower efficiency ratio • 2008 operating expenses at least $200M below 2007 |
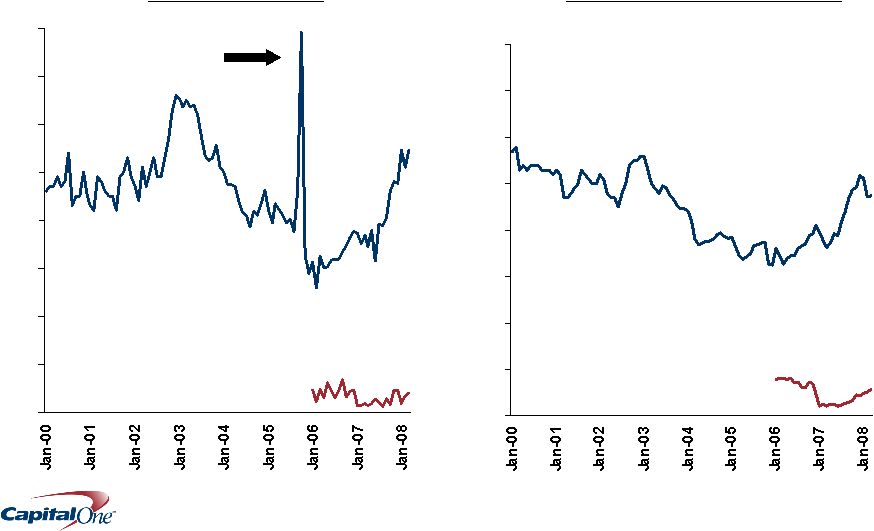 6 0% 1% 2% 3% 4% 5% 6% 7% 8% Credit metrics reflect weakening in the U.S. economy 0% 1% 2% 3% 4% 5% 6% 7% 8% Monthly Managed Net Charge-off Rate Monthly Managed Delinquency and Non-Performing Loan Rate Bankruptcy Filing Spike National Lending Local Banking Local Banking: Non-performing loans as % of loans National Lending 30+ Delinquency Rate Q108: 5.34% Q108: 0.31% Q108 4.73% Q108 0.56% |
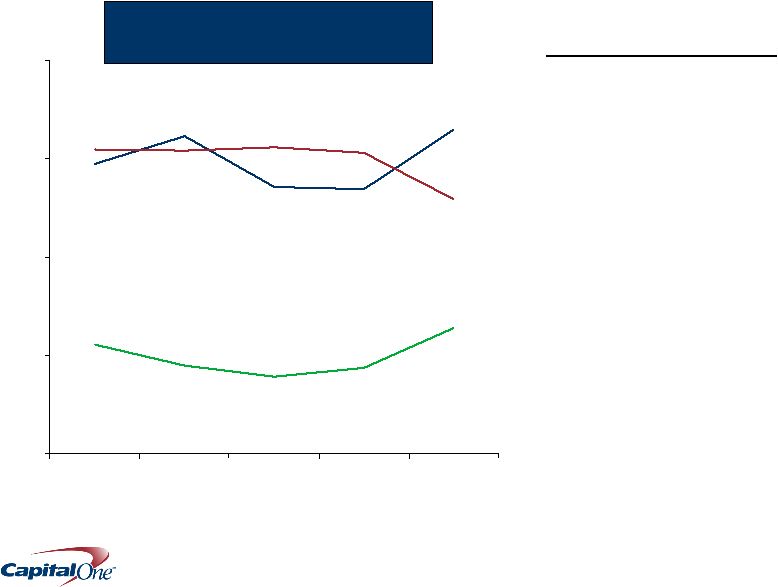 7 Given the deteriorating outlook for the US economy, we have increased our loan loss allowance 165% 64% 129% 134% 44% 153% 0% 50% 100% 150% 200% Q107 Q207 Q307 Q407 Q108 Quarterly Highlights • Increased loan loss allowance by $310M to $3.3B • Allowance consistent with managed charge-offs of approximately $6.7B over the next 12 months Allowance as % of Reported 30+ Delinquencies US Card Auto International Allowance as % of Reported Loans 2.3% 2.3% 2.4% 2.9% 3.3% |
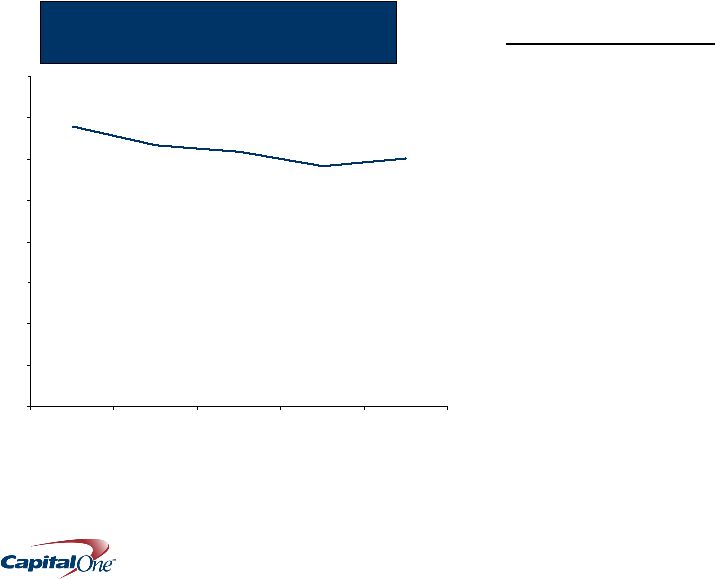 8 Despite credit headwinds, we remain capital generative 2008 Expectations • TCE ratio at or above high-end of 5.5%-6% target range • Expect to continue $0.375 quarterly dividend • Share buybacks dependent on economic outlook – 2H08 at the earliest 6.03% 5.83% 0% 1% 2% 3% 4% 5% 6% 7% 8% Q107 Q207 Q307 Q407 Q108 Tangible Common Equity to Tangible Managed Assets Ratio |
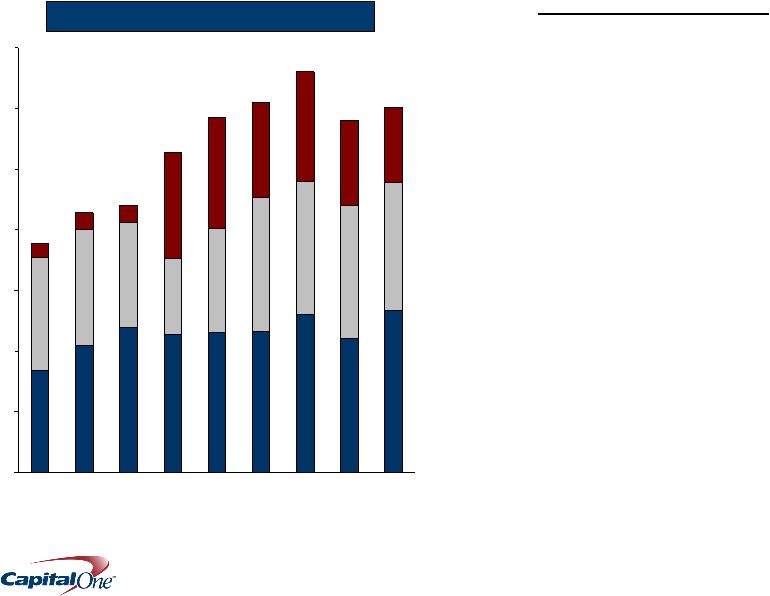 9 0 5 10 15 20 25 30 35 1Q06 2Q06 3Q06 4Q06 1Q07 2Q07 3Q07 4Q07 1Q08 We continue to maintain ample liquidity Quarterly Highlights • Liquidity position is 5x next 12 months of capital markets funding plan • Moved Auto Finance to be a subsidiary of National Bank • $5.7B Holding company cash: – Covers parent obligations for over 2 years, including common stock and dividends • Maintained strong, diversified funding – Q1 deposit growth of $4.9B – $3.0B AAA US Card ABS YTD • Highly liquid, low risk investment portfolio $B Readily Available Liquidity Undrawn FHLB Capacity Unencumbered Securities Undrawn Conduit $30B $29B |
 10 Capital One remains highly profitable despite significant cyclical credit headwinds Net Income from Continuing Operations ($Millions) Q108 Q407 Q307 Q207 Q107 National Lending US Card $ 491.2 $ 498.7 $ 626.8 $ 592.9 $ 538.5 Auto Finance (82.4) (112.4) (3.8) 38.0 44.4 International 33.3 54.7 47.4 18.2 19.5 SUBTOTAL 442.1 441.0 670.4 649.1 602.3 Local Banking 75.8 103.6 195.5 154.8 139.2 Other 114.6 (223.0) (49.6) (36.3) (55.4) Total Company $ 632.6 $ 321.6 $ 816.4 $ 767.6 $ 686.1 |
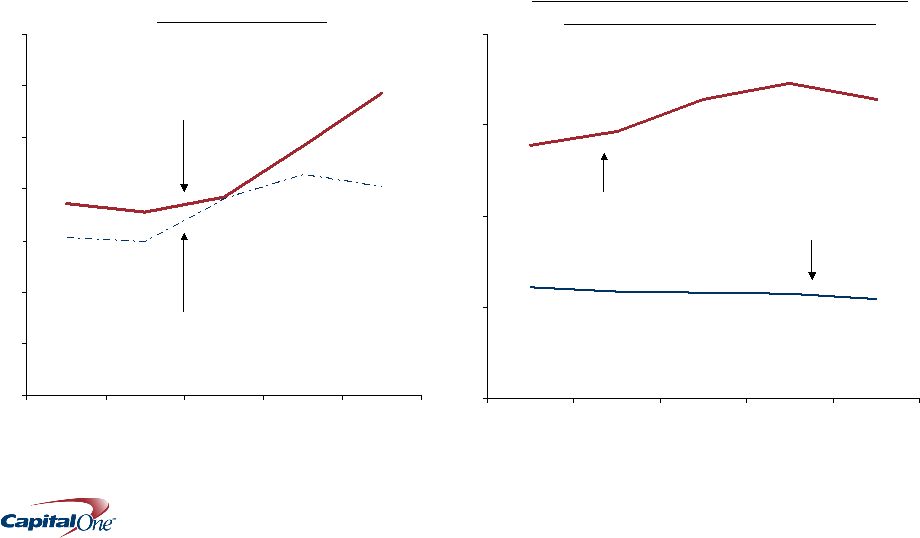 11 We are taking action to strengthen resiliency and sustain the strong financial returns of our US Card business 3.56% 3.85% 4.84% 3.72% 5.85% 2.98% 3.06% 3.80% 4.28% 4.04% 0% 1% 2% 3% 4% 5% 6% 7% Q107 Q207 Q307 Q407 Q108 US Card Credit Risk Metrics 16.42% 13.92% 17.31% 16.42% 14.67% 5.48% 5.76% 5.81% 6.11% 5.88% 0% 5% 10% 15% 20% Q107 Q207 Q307 Q407 Q108 US Card Revenue Margin and Non-Interest Expenses as a % of Average Loans Revenue Margin Managed Net Charge-off Rate Non-Interest Expenses as a % of Average Loans Managed 30+ Delinquency Rate |
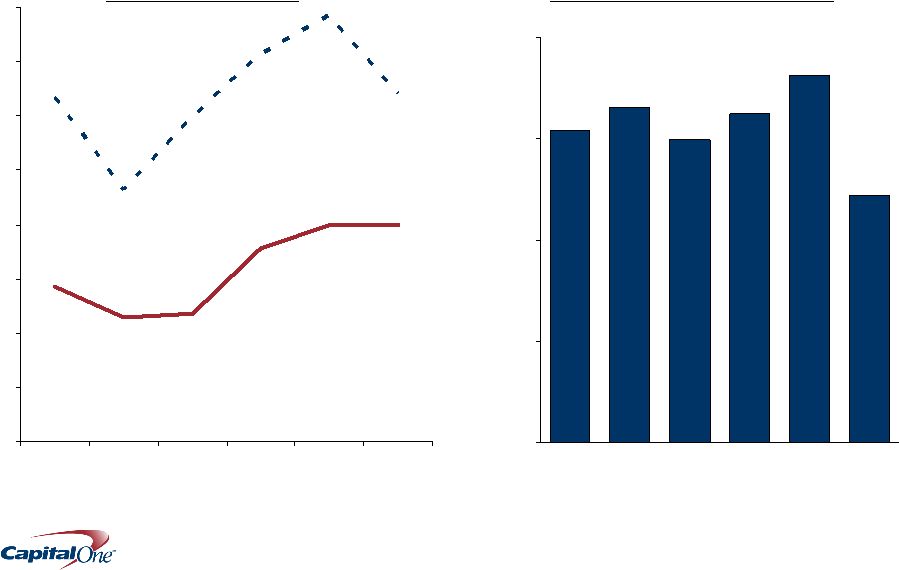 12 3.98% 4.00% 2.85% 2.29% 3.56% 2.35% 6.42% 7.84% 7.15% 6.00% 4.64% 6.35% 0% 1% 2% 3% 4% 5% 6% 7% 8% Q406 Q107 Q207 Q307 Q407 Q108 Credit Risk Metrics (1) Based on internal allocations of consolidated results Managed Net Charge-off Rate Managed 30+ Delinquency Rate $3.1 $3.3 $3.0 $3.2 $3.6 $2.4 $0 $1 $2 $3 $4 Q406 Q107 Q207 Q307 Q407 Q108 We continue to aggressively retrench and reposition our auto business for resilience Auto Loan Originations ($B) |
 13 Bank integration was largely completed in the quarter 0.31% 0.15% 0.19% 0.28% 0.19% 0.56% 0.41% 0.27% 0.19% 0.19% 0% 1% 2% Q107 Q207 Q307 Q407 Q108 Credit Risk Metrics Managed Net Charge-off Rate Non Performing Loans as a % of Loans • Launched new Capital One logo • Completed brand conversion of former North Fork branches • Consolidated banking operations onto a single deposit platform $0 $10 $20 $30 $40 $50 $60 $70 $80 $41.6 Deposit and Loan Portfolio ($B) Loans Deposits $74.3 Q107 Q207 Q307 Q407 $74.3 $41.9 Q108 $72.8 $42.2 $73.1 $44.0 $44.2 $73.4 |
 14 We expect sound operating metrics in 2008, despite continued credit headwinds Commentary Loan/Deposit Growth Cautious on loan growth; bullish on deposit growth Revenue Growth Revenue margin remains strong Cost Management Capital Management Expect to continue $0.375 quarterly dividend; share repurchases dependent on economic outlook; 2H08 at the earliest Credit Expectations Allowance at 3/31/08 consistent with $6.7B in charge- offs for the next 12 months 2008 Outlook Flat loan growth; double-digit deposit growth Efficiency ratio in the low-to mid- 40%’s Manage to the high end or above 5.5-6.0% TCE target Continued economic weakness At least $200M Y/Y OpEx reduction vs. 2007 Low-to mid-single digits |
 15 Our actions position Capital One to deliver shareholder value over the cycle Strong Position Decisive Actions • Resilient businesses • Conservatism imbedded in underwriting decisions • Banking transformation – Fortified funding and liquidity – Strong capital position – Broad funding flexibility • Pulled back on loan growth across lending businesses – Tightened underwriting across lending businesses • Retrenching and repositioning Auto Finance • Pulled back or exited least resilient businesses • Shut down GreenPoint Mortgage origination businesses • Increased pricing to strengthen margins • Driving strong operating efficiency gains • Enhancing and leveraging strong balance sheet • Managing capital with discipline |
| 16 Appendix |
 17 Q108/Q407 Change Q108 Q407 Q107 $ %/bps Total Deposits $ 87,695 $ 82,761 $ 87,471 $ 4,934 6.0 % Total Managed Loans Held for Investment 148,037 151,362 142,005 (3,325) (2.2) Tangible Assets 185,962 185,428 180,501 534 0.3 Tangible Common Equity 11,220 10,814 12,270 406 3.8 Tangible Common Equity to Tangible Assets Ratio 6.03 % 5.83 % 6.80 % n/a 20 bps Net Interest Margin 6.78 % 6.83 % 6.15 % n/a (5) bps Revenue Margin 10.43 10.40 9.20 n/a 3 Return on Average Managed Assets 1.27 0.64 1.42 n/a 63 Return on Average Equity 10.30 5.20 10.72 n/a 510 Return on Average Tangible Common Equity 22.70 11.54 24.53 n/a 1,116 Managed Balance Sheet Highlights ($Millions) First quarter 2008 balance sheet and return metrics from Continuing Operations |
 18 Q108/Q407 Change Q108 Q407 Q107 $ %/bps Net Interest Income $ 2,976.8 $ 3,000.5 $ 2,602.5 $ (23.7) (1) % Non-Interest Income 1,606.7 1,566.2 1,294.1 40.5 3 Total Revenue 4,583.5 4,566.7 3,896.6 16.8 0 % Net Charge-offs $ 1,482.3 $ 1,296.2 $ 947.3 $ 186.1 14 % Allowance Build 310.4 643.0 (75.0) (332.6) (52) Other 1.5 1.1 (4.6) 0.4 36 Provision for Loan Losses 1,794.2 1,940.3 867.7 (146.1) (8) % Marketing Expenses $ 297.8 $ 358.2 $ 330.9 (60.4) (17) % Restructuring Expenses 52.8 27.8 - 25.0 90 Operating Expenses 1,471.7 1,749.2 1,643.2 (277.5) (16) Tax Rate 34.6 % 34.5 % 35.0 % n/a 10 bps Income from Continuing Operations, Net of Tax $ 632.6 $ 321.6 $ 686.1 $ 311.0 97 % Loss from Discontinued Operations, Net of Tax (84.1) (95.0) (11.1) 10.9 11 Net Income 548.5 226.6 675.0 321.9 142 Shares Used to Compute Diluted EPS (MM) 372.3 378.4 415.5 n/a (2) % Diluted EPS from Continuing Operations $ 1.70 $ 0.85 $ 1.65 $ 0.85 100 % Diluted EPS from Discontinued Operations (0.23) (0.25) (0.03) 0.02 (8) % Managed Income Statement Highlights ($Millions except per share data) First quarter 2008 managed income statement |
 19 With the $310M build in Q108, our allowance for loan losses is consistent with $6.7B of managed charge offs for the next 12 months Charge-offs and Allowance for Loan Losses ($Millions) 1 : Based on Continuing Operations. 2 : Based on Total Company balance sheet. Q108/Q407 Change Q108 Q407 Q107 $ %/bps Managed Net Charge-offs 1 $ 1,482.3 $ 1,296.2 $ 947.3 $ 186.1 14 % Allowance Build1 310.4 643.0 (75.0) (332.6) (52) Other 1 1.5 1.1 (4.6) 0.4 36 Managed Provision for Loan Losses 1 1,794.2 1,940.3 867.7 (146.1) (8) % Reported Net Charge-off Rate 1 3.07 % 2.66 % 1.84 % n/a 41 bps Reported Loans 2 $ 98,356 $ 101,805 $ 90,869 $ (3,449) (3) % Allowance for Loan Losses 2 3,273 2,963 2,105 310 10 Reported 30+ Day Delinquencies 2 3,207 3,721 2,093 (514) (14) Reported 30+ Delinquency Rate 2 3.26 % 3.66 % 2.30 % n/a (40) bps |