
UNITED STATES
SECURITIES AND EXCHANGE COMMISSION
Washington, DC 20549
FORM 8-K
CURRENT REPORT
Pursuant to Section 13 OR 15(d) of
The Securities Exchange Act of 1934
April 20, 2005
Date of Report (Date of earliest event reported)
CAPITAL ONE FINANCIAL CORPORATION
(Exact name of registrant as specified in its chapter)
| Delaware | 1-13300 | 54-1719854 | ||
| (State or other jurisdiction of incorporation) |
(Commission File Number) |
(IRS Employer Identification No.) |
| 1680 Capital One Drive, McLean, Virginia |
22102 | |
| (Address of principal executive offices) | (Zip Code) |
Registrant’s telephone number, including area code: (703) 720-1000
(Former name or former address, if changed since last report)
Check the appropriate box below if the Form 8-K filing is intended to simultaneously satisfy the filing obligation of the registrant under any of the following provisions (see General Instruction A.2. below):
| x | Written communications pursuant to Rule 425 under the Securities Act (17 CFR 230.425) |
| ¨ | Soliciting material pursuant to Rule 14a-12 under the Exchange Act (17 CFR 240.14a-12) |
| ¨ | Pre-commencement communications pursuant to Rule 14d-2(b) under the Exchange Act (17 CFR 240.14d-2(b)) |
| ¨ | Pre-commencement communications pursuant to Rule 13e-4(c) under the Exchange Act (17 CFR 240.13e-4(c)) |
Item 2.02. Results of Operations and Financial Condition
On April 20, 2005, the Company issued a press release announcing its financial results for the first quarter ended March 31, 2005. A copy of the Company’s press release is attached and filed herewith as Exhibit 99.1 to this Form 8-K and is incorporated herein by reference.
The Company’s consolidated financial statements prepared in accordance with generally accepted accounting principles (“GAAP”) are referred to as its “reported” financial statements. Loans included in securitization transactions which qualified as sales under GAAP have been removed from the Company’s “reported” balance sheet. However, servicing fees, finance charges, and other fees, net of charge-offs, and interest paid to investors of securitizations are recognized as servicing and securitizations income on the “reported” income statement.
The Company’s “managed” consolidated financial statements reflect adjustments made related to effects of securitization transactions qualifying as sales under GAAP. The Company generates earnings from its “managed” loan portfolio which includes both the on-balance sheet loans and off-balance sheet loans. The Company’s “managed” income statement takes the components of the servicing and securitizations income generated from the securitized portfolio and distributes the revenue and expense to appropriate income statement line items from which it originated. For this reason the Company believes the “managed” consolidated financial statements and related managed metrics to be useful to stakeholders.
Item 7.01. Regulation FD Disclosure.
The Company hereby furnishes the information in Exhibit 99.2 hereto, First Quarter Earnings Presentation for the quarter ended March 31, 2005.
Note: Information in Exhibit 99.2 furnished pursuant to Item 7.01 shall not be deemed to be “filed” for the purposes of Section 18 of the Securities Exchange Act of 1934 or otherwise subject to the liabilities of that section. This report will not be deemed an admission as to the materiality of any information in the report that is required to be disclosed solely by Regulation FD. Furthermore, the information provided in Exhibit 99.2 shall not be deemed to be incorporated by reference into the filings of the Company under the Securities Act of 1933.
2
Item 8.01. Other Events.
| (a) | See attached press release, at Exhibit 99.1. |
| (b) | Cautionary Factors. |
The attached press release and information provided pursuant to Items 2.02, 7.01 and 9.01 contain forward-looking statements, which involve a number of risks and uncertainties. The Company cautions readers that any forward-looking information is not a guarantee of future performance and that actual results could differ materially from those contained in the forward-looking information as a result of various factors including, but not limited to, the following:
| • | continued intense competition from numerous providers of products and services which compete with the Company’s businesses; |
| • | an increase or decrease in credit losses (including increases due to a worsening of general economic conditions); |
| • | the ability of the Company to continue to securitize its credit cards and consumer loans and to otherwise access the capital markets at attractive rates and terms to capitalize and fund its operations and future growth; |
| • | financial, legal, regulatory, accounting changes or actions that may affect investment in, or the overall performance of, a product or business, including changes in existing law and regulation affecting the credit card and consumer loan industry, in particular (including federal bank examiner guidance affecting credit card and/or subprime lending) and the financial services industry, in general (including the ability of financial services companies to obtain, use and share consumer data); |
| • | changes in interest rates; |
| • | general economic conditions affecting consumer income, spending and repayments which may affect consumer bankruptcies or defaults and hence delinquencies and charge-offs; |
| • | with respect to financial and other products, changes in the Company’s aggregate accounts or consumer loan balances and the growth rate and composition thereof, including changes resulting from factors such as shifting product mix, amount of actual marketing expenses made by the Company and attrition of accounts and loan balances; |
| • | changes in the reputation of the credit card industry and/or the Company with respect to practices or products; |
| • | the Company’s ability to successfully continue to diversify its assets; |
| • | any significant disruption in our operations or technology platform; |
| • | the amount of, and rate of growth in, the Company’s expenses (including salaries and associate benefits and marketing expenses) as the Company’s business develops or changes or as it expands into new market areas; |
| • | the ability of the Company to build the operational and organizational infrastructure necessary to engage in new businesses or to expand internationally; |
| • | the Company’s ability to execute on its strategic and operational plans; |
| • | any significant disruption of, or loss of public confidence in, the United States Mail service affecting our response rates and consumer payments; |
| • | the ability of the Company to recruit and retain experienced personnel to assist in the management and operations of new products and services; |
| • | the ability to obtain regulatory approvals of the proposed Capital One – Hibernia transaction on the proposed terms and schedule; |
| • | the failure of Hibernia stockholders to approve the transaction; |
| • | the risk that the businesses will not be integrated successfully; |
| • | the risk that the cost savings and any other synergies from the transaction may not be fully realized or may take longer to realize than expected; |
| • | disruption from the transaction making it more difficult to maintain relationships with customers, employees or suppliers; and |
| • | other risk factors listed from time to time in the Company’s and Hibernia’s SEC reports, including, but not limited to, the Annual Report on Form 10-K for the year ended December 31, 2004. |
3
Additional Information About the Capital One – Hibernia Transaction
In connection with the proposed merger between Capital One and Hibernia Corporation, Capital One will file with the Securities and Exchange Commission (the “SEC”) a Registration Statement on Form S-4 that will include a proxy statement of Hibernia that also constitutes a prospectus of Capital One. Hibernia will mail the proxy statement/prospectus to its stockholders. Investors and security holders are urged to read the proxy statement/prospectus regarding the proposed merger when it becomes available because it will contain important information. You may obtain a free copy of the proxy statement/prospectus (when available) and other related documents filed by Capital One and Hibernia with the SEC at the SEC’s website at www.sec.gov. The proxy statement/prospectus (when it is available) and the other documents may also be obtained for free by accessing Capital One’s website at www.capitalone.com under the tab “Investors” and then under the heading “SEC & Regulatory Filings” or by accessing Hibernia’s website at www.hibernia.com under the tab “About Hibernia” and then under the heading “Investor Relations—SEC Filings”.
Capital One, Hibernia and their respective directors, executive officers and certain other members of management and employees may be soliciting proxies from Hibernia stockholders in favor of the merger. Information regarding the persons who may, under the rules of the SEC, be considered participants in the solicitation of the Hibernia stockholders in connection with the proposed merger will be set forth in the proxy statement/prospectus when it is filed with the SEC. You can find information about Capital One’s executive officers and directors in its definitive proxy statement filed with the SEC on March 21, 2005. You can find information about Hibernia’s executive officers and directors in its definitive proxy statement filed with the SEC on March 15, 2005. You can obtain free copies of these documents from Capital One and Hibernia using the contact information above.
Item 9.01. Financial Statements, Pro Forma Financial Information and Exhibits.
| (c) | Exhibits. |
| Exhibit No. |
Description of Exhibit | |
| 99.1 | Press release, dated March 31, 2005. (This exhibit shall be deemed to be “filed” with this Form 8-K) | |
| 99.2 | First Quarter Earnings Presentation. |
Earnings Conference Call Webcast Information.
Capital One will hold an earnings conference call on April 20, 2005, 5:00 PM Eastern time. The conference call will be accessible through live webcast. Interested investors and other interested individuals can access the webcast via Capital One’s home page (http://www.capitalone.com). Choose “About Capital One” and then “Investor Overview” to access the Investor Center and view and/or download the earnings press release, a reconciliation to GAAP financial measures and other relevant financial information. The replay of the webcast will be archived on Capital One’s website through May 6, 2005.
4
SIGNATURE
Pursuant to the requirements of the Securities Exchange Act of 1934, the Company has duly caused this Current Report on Form 8-K to be signed on its behalf by the undersigned, hereunto duly authorized.
| CAPITAL ONE FINANCIAL CORPORATION | ||||
| Dated: April 20, 2005 |
By: |
/s/ GARY L. PERLIN | ||
| Gary L. Perlin Executive Vice President and Chief Financial Officer | ||||
5
EXHIBIT INDEX
| 99.1 | Press Release of the Company dated April 20, 2005. |
| 99.2 | First Quarter Earnings Presentation. |
6
Exhibit 99.1
CAPITAL ONE FINANCIAL CORPORATION (COF)
FINANCIAL & STATISTICAL SUMMARY REPORTED BASIS
| (in millions, except per share data and as noted) |
2005 Q1 |
2004 Q4 |
2004 Q3 |
2004 Q2 |
2004 Q1 |
|||||||||||||||
| Earnings (Reported Basis) |
||||||||||||||||||||
| Net Interest Income |
$ | 860.5 | $ | 784.6 | $ | 775.4 | $ | 711.0 | $ | 732.0 | ||||||||||
| Non-Interest Income |
1,516.0 | 1,521.5 | (1) | 1,539.4 | (1) | 1,396.1 | 1,443.1 | |||||||||||||
| Total Revenue(2) |
2,376.5 | 2,306.1 | 2,314.8 | 2,107.1 | 2,175.1 | |||||||||||||||
| Provision for Loan Losses |
259.6 | 467.1 | 267.8 | 242.3 | 243.7 | |||||||||||||||
| Marketing Expenses |
311.8 | 511.1 | 317.7 | 253.8 | 255.1 | |||||||||||||||
| Operating Expenses |
1,016.1 | (3) | 1,045.4 | (3) | 994.3 | (3) | 975.0 | (3) | 969.7 | |||||||||||
| Income Before Taxes |
789.0 | 282.5 | 735.0 | 636.0 | 706.6 | |||||||||||||||
| Tax Rate |
35.8 | % | 30.9 | % | 33.3 | % | 36.0 | % | 36.2 | % | ||||||||||
| Net Income |
$ | 506.6 | $ | 195.1 | $ | 490.2 | $ | 407.4 | $ | 450.8 | ||||||||||
| Common Share Statistics |
||||||||||||||||||||
| Basic EPS |
$ | 2.08 | $ | 0.82 | $ | 2.07 | $ | 1.74 | $ | 1.94 | ||||||||||
| Diluted EPS |
$ | 1.99 | $ | 0.77 | $ | 1.97 | $ | 1.65 | $ | 1.84 | ||||||||||
| Dividends Per Share |
$ | 0.03 | $ | 0.03 | $ | 0.03 | $ | 0.03 | $ | 0.03 | ||||||||||
| Book Value Per Share (period end) |
$ | 35.62 | $ | 33.99 | $ | 32.67 | $ | 29.90 | $ | 28.54 | ||||||||||
| Stock Price Per Share (period end) |
$ | 74.77 | $ | 84.21 | $ | 73.90 | $ | 68.38 | $ | 75.43 | ||||||||||
| Total Market Capitalization (period end) |
$ | 18,849.5 | $ | 20,783.0 | $ | 17,936.8 | $ | 16,514.5 | $ | 18,084.9 | ||||||||||
| Shares Outstanding (period end) |
252.1 | 246.8 | 242.7 | 241.5 | 239.8 | |||||||||||||||
| Shares Used to Compute Basic EPS |
244.0 | 239.2 | 236.4 | 234.7 | 232.0 | |||||||||||||||
| Shares Used to Compute Diluted EPS |
255.2 | 253.0 | 249.0 | 247.6 | 245.4 | |||||||||||||||
| Reported Balance Sheet Statistics (period avg.) |
||||||||||||||||||||
| Average Loans |
$ | 38,204 | $ | 36,096 | $ | 34,772 | $ | 33,290 | $ | 32,878 | ||||||||||
| Average Earning Assets |
$ | 50,898 | $ | 49,500 | $ | 47,267 | $ | 45,705 | $ | 44,112 | ||||||||||
| Average Assets |
$ | 56,288 | $ | 53,339 | $ | 51,496 | $ | 50,020 | $ | 47,699 | ||||||||||
| Average Equity |
$ | 8,568 | $ | 8,221 | $ | 7,561 | $ | 6,943 | $ | 6,443 | ||||||||||
| Return on Average Assets (ROA) |
3.60 | % | 1.46 | % | 3.81 | % | 3.26 | % | 3.78 | % | ||||||||||
| Return on Average Equity (ROE) |
23.65 | % | 9.49 | % | 25.93 | % | 23.47 | % | 27.99 | % | ||||||||||
| Reported Balance Sheet Statistics (period end) |
||||||||||||||||||||
| Loans |
$ | 37,959 | $ | 38,216 | $ | 35,161 | $ | 34,551 | $ | 33,172 | ||||||||||
| Total Assets |
$ | 55,632 | $ | 53,747 | $ | 51,960 | $ | 50,070 | $ | 49,146 | ||||||||||
| Capital(4) |
$ | 9,839 | $ | 9,231 | $ | 8,769 | $ | 8,057 | $ | 7,675 | ||||||||||
| Loan growth |
$ | (257 | ) | $ | 3,055 | $ | 610 | $ | 1,379 | $ | 321 | |||||||||
| % Loan Growth Q Over Q (annualized) |
(3 | )% | 35 | % | 7 | % | 17 | % | 4 | % | ||||||||||
| % Loan Growth Y Over Y |
14 | % | 16 | % | 15 | % | 29 | % | 20 | % | ||||||||||
| Capital to Assets Ratio |
17.69 | % | 17.17 | % | 16.88 | % | 16.09 | % | 15.62 | % | ||||||||||
| Capital plus Allowance to Assets Ratio |
20.27 | % | 19.98 | % | 19.56 | % | 18.94 | % | 18.66 | % | ||||||||||
| Revenue & Expense Statistics (Reported) |
||||||||||||||||||||
| Net Interest Income Growth (annualized) |
39 | % | 5 | % | 36 | % | (11 | )% | 41 | % | ||||||||||
| Non Interest Income Growth (annualized) |
(1 | )% | (5 | )% | 41 | % | (13 | )% | 2 | % | ||||||||||
| Revenue Growth (annualized) |
12 | % | (2 | )% | 39 | % | (13 | )% | 14 | % | ||||||||||
| Net Interest Margin |
6.76 | % | 6.34 | % | 6.56 | % | 6.22 | % | 6.64 | % | ||||||||||
| Revenue Margin |
18.68 | % | 18.64 | % | 19.59 | % | 18.44 | % | 19.72 | % | ||||||||||
| Risk Adjusted Margin(5) |
16.08 | % | 15.85 | % | 17.07 | % | 15.73 | % | 16.62 | % | ||||||||||
| Operating Expense as a % of Revenues |
42.76 | % | 45.33 | % | 42.95 | % | 46.27 | % | 44.58 | % | ||||||||||
| Operating Expense as a % of Avg Loans (annualized) |
10.64 | % | 11.58 | % | 11.44 | % | 11.72 | % | 11.80 | % | ||||||||||
| Asset Quality Statistics (Reported) |
||||||||||||||||||||
| Allowance |
$ | 1,440 | $ | 1,505 | $ | 1,395 | $ | 1,425 | $ | 1,495 | ||||||||||
| 30+ Day Delinquencies |
$ | 1,319 | $ | 1,472 | $ | 1,407 | $ | 1,351 | $ | 1,266 | ||||||||||
| Net Charge-Offs |
$ | 330 | $ | 345 | $ | 298 | $ | 310 | $ | 342 | ||||||||||
| Allowance as a % of Reported Loans |
3.79 | % | 3.94 | % | 3.97 | % | 4.12 | % | 4.51 | % | ||||||||||
| Delinquency Rate (30+ days) |
3.47 | % | 3.85 | % | 4.00 | % | 3.91 | % | 3.82 | % | ||||||||||
| Net Charge-Off Rate |
3.46 | % | 3.82 | % | 3.43 | % | 3.72 | % | 4.17 | % | ||||||||||
| (1) | Includes a $41.1 million gain resulting from the sale of the French loan portfolio in Q4 2004 and a $31.5 million gain resulting from the sale of a joint venture investment in South Africa in Q3 2004. |
| (2) | In accordance with the Company's finance charge and fee revenue recognition policy, the amounts billed to customers but not recognized as revenue were as follows: Q1 2005—$243.9, Q4 2004—$276.8, Q3 2004—$269.7, Q2 2004—$263.5 million, and Q1 2004—$285.5 million. |
| (3) | Includes employee termination benefits and charges for facility consolidation related to corporate-wide cost reduction initiatives of $23.7 million, $42.1 million, $26.7 million and $56.0 million for Q1 2005, Q4 2004, Q3 2004 and Q2 2004, respectively. In addition, Q1 2005 includes a $18.8 million reversal of a previously recognized impairment related to the sale of the Tampa, FL facility and Q3 2004 had charges of $20.6 million related to a change in the fixed asset capitalization thresholds and $15.8 million related to impairment of internally developed software. |
| (4) | Includes preferred interests and mandatory convertible securities. |
| (5) | Risk adjusted margin is total revenue less net charge-offs as a percentage of average earning assets. |
CAPITAL ONE FINANCIAL CORPORATION (COF)
FINANCIAL & STATISTICAL SUMMARY MANAGED BASIS(1)
| (in millions) |
2005 Q1 |
2004 Q4 |
2004 Q3 |
2004 Q2 |
2004 Q1 |
|||||||||||||||
| Earnings (Managed Basis) |
||||||||||||||||||||
| Net Interest Income |
$ | 1,818.8 | $ | 1,701.8 | $ | 1,670.4 | $ | 1,585.4 | $ | 1,677.1 | ||||||||||
| Non-Interest Income |
1,071.4 | 1,099.0 | (2) | 1,099.8 | (2) | 1,011.3 | 1,014.5 | |||||||||||||
| Total Revenue(3) |
2,890.2 | 2,800.8 | 2,770.2 | 2,596.7 | 2,691.6 | |||||||||||||||
| Provision for Loan Losses |
773.3 | 961.8 | 723.2 | 731.9 | 760.1 | |||||||||||||||
| Marketing Expenses |
311.8 | 511.1 | 317.7 | 253.8 | 255.1 | |||||||||||||||
| Operating Expenses |
1,016.1 | (4) | 1,045.4 | (4) | 994.3 | (4) | 975.0 | (4) | 969.7 | |||||||||||
| Income Before Taxes |
789.0 | 282.5 | 735.0 | 636.0 | 706.6 | |||||||||||||||
| Tax Rate |
35.8 | % | 30.9 | % | 33.3 | % | 36.0 | % | 36.2 | % | ||||||||||
| Net Income |
$ | 506.6 | $ | 195.1 | $ | 490.2 | $ | 407.4 | $ | 450.8 | ||||||||||
| Managed Balance Sheet Statistics (period avg.) |
||||||||||||||||||||
| Average Loans |
$ | 81,652 | $ | 76,930 | $ | 74,398 | $ | 72,327 | $ | 71,148 | ||||||||||
| Average Earning Assets |
$ | 92,477 | $ | 88,461 | $ | 85,045 | $ | 82,905 | $ | 80,495 | ||||||||||
| Average Assets |
$ | 99,283 | $ | 93,574 | $ | 90,543 | $ | 88,473 | $ | 85,324 | ||||||||||
| Return on Average Assets (ROA) |
2.04 | % | 0.83 | % | 2.17 | % | 1.84 | % | 2.11 | % | ||||||||||
| Managed Balance Sheet Statistics (period end) |
||||||||||||||||||||
| Loans |
$ | 81,592 | $ | 79,861 | $ | 75,457 | $ | 73,367 | $ | 71,817 | ||||||||||
| Total Assets |
$ | 98,724 | $ | 94,792 | $ | 91,665 | $ | 88,317 | $ | 87,197 | ||||||||||
| Loan Growth |
$ | 1,731 | $ | 4,404 | $ | 2,090 | $ | 1,550 | $ | 572 | ||||||||||
| % Loan Growth Q over Q (annualized) |
9 | % | 23 | % | 11 | % | 9 | % | 3 | % | ||||||||||
| % Loan Growth Y over Y |
14 | % | 12 | % | 12 | % | 21 | % | 21 | % | ||||||||||
| Capital to Assets Ratio |
9.97 | % | 9.74 | % | 9.57 | % | 9.12 | % | 8.80 | % | ||||||||||
| Capital plus Allowance to Assets Ratio |
11.42 | % | 11.33 | % | 11.09 | % | 10.74 | % | 10.52 | % | ||||||||||
| Number of Accounts (000’s) |
49,062 | 48,573 | 47,224 | 46,591 | 46,712 | |||||||||||||||
| % Off-Balance Sheet Securitizations |
53 | % | 52 | % | 53 | % | 53 | % | 53 | % | ||||||||||
| % at Introductory Rate |
6 | % | 7 | % | 6 | % | 6 | % | 8 | % | ||||||||||
| Revenue & Expense Statistics (Managed) |
||||||||||||||||||||
| Net Interest Income Growth (annualized) |
28 | % | 8 | % | 21 | % | (22 | )% | 27 | % | ||||||||||
| Non Interest Income Growth (annualized) |
(10 | )% | 0 | % | 35 | % | (1 | )% | (23 | )% | ||||||||||
| Revenue Growth (annualized) |
13 | % | 4 | % | 27 | % | (14 | )% | 6 | % | ||||||||||
| Net Interest Margin |
7.87 | % | 7.70 | % | 7.86 | % | 7.65 | % | 8.33 | % | ||||||||||
| Revenue Margin |
12.50 | % | 12.66 | % | 13.03 | % | 12.53 | % | 13.38 | % | ||||||||||
| Risk Adjusted Margin (5) |
8.85 | % | 8.87 | % | 9.48 | % | 8.67 | % | 9.11 | % | ||||||||||
| Operating Expense as a % of Revenues |
35.16 | % | 37.33 | % | 35.89 | % | 37.55 | % | 36.03 | % | ||||||||||
| Operating Expense as a % of Avg Loans (annualized) |
4.98 | % | 5.44 | % | 5.35 | % | 5.39 | % | 5.45 | % | ||||||||||
| Asset Quality Statistics (Managed) |
||||||||||||||||||||
| 30+ Day Delinquencies |
$ | 2,812 | $ | 3,054 | $ | 2,944 | $ | 2,756 | $ | 2,731 | ||||||||||
| Net Charge-Offs |
$ | 844 | $ | 840 | $ | 754 | $ | 800 | $ | 859 | ||||||||||
| Delinquency Rate (30+ days) |
3.45 | % | 3.82 | % | 3.90 | % | 3.76 | % | 3.80 | % | ||||||||||
| Net Charge-Off Rate |
4.13 | % | 4.37 | % | 4.05 | % | 4.42 | % | 4.83 | % | ||||||||||
| (1) | The information in this statistical summary reflects the adjustment to add back the effect of securitization transactions qualifying as sales under generally accepted accounting principles. See accompanying schedule - “Reconciliation to GAAP Financial Measures”. |
| (2) | Includes a $41.1 million gain resulting from the sale of the French loan portfolio in Q4 2004 and a $31.5 million gain resulting from the sale of a joint venture investment in South Africa in Q3 2004. |
| (3) | In accordance with the Company’s finance charge and fee revenue recognition policy, the amounts billed to customers but not recognized as revenue were as follows: Q1 2005 - $243.9, Q4 2004 - $276.8, Q3 2004 - $269.7, Q2 2004 - $263.5 million, and Q1 2004 - $285.5 million. |
| (4) | Includes employee termination benefits and charges for facility consolidation related to corporate-wide cost reduction initiatives of $23.7 million, $42.1 million, $26.7 million and $56.0 million for Q1 2005, Q4 2004, Q3 2004 and Q2 2004, respectively. In addition, Q1 2005 includes a $18.8 million reversal of a previously recognized impairment related to the sale of the Tampa, FL facility and Q3 2004 had charges of $20.6 million related to a change in the fixed asset capitalization thresholds and $15.8 million related to impairment of internally developed software. |
| (5) | Risk adjusted margin is total revenue less net charge-offs as a percentage of average earning assets. |
CAPITAL ONE FINANCIAL CORPORATION (COF)
SEGMENT FINANCIAL & STATISTICAL SUMMARY - MANAGED BASIS(1)
| (in thousands) |
2005 Q1 |
2004 Q4 |
2004 Q3 |
2004 Q2 |
2004 Q1 |
|||||||||||||||
| Segment Statistics |
||||||||||||||||||||
| US Card: |
||||||||||||||||||||
| Net Interest income |
1,250,638 | $ | 1,158,773 | $ | 1,172,447 | $ | 1,124,099 | $ | 1,200,577 | |||||||||||
| Non-interst income |
779,415 | 823,012 | 811,465 | 816,034 | 769,056 | |||||||||||||||
| Provision for loan losses |
489,036 | 649,862 | 503,179 | 519,569 | 535,279 | |||||||||||||||
| Non-interest expenses |
836,142 | 1,016,384 | 833,183 | 820,424 | 829,925 | |||||||||||||||
| Income tax provision (benefit) |
246,706 | 113,594 | 233,118 | 216,051 | 217,594 | |||||||||||||||
| Net income (loss) |
$ | 458,169 | $ | 201,945 | $ | 414,432 | $ | 384,089 | $ | 386,835 | ||||||||||
| Loans receivable |
$ | 46,629,763 | $ | 48,609,571 | $ | 46,081,967 | $ | 45,247,444 | $ | 45,297,959 | ||||||||||
| Net charge-off rate |
4.73 | % | 4.93 | % | 4.68 | % | 5.19 | % | 5.41 | % | ||||||||||
| Delinquency Rate (30+ days) |
3.66 | % | 3.97 | % | 4.14 | % | 3.95 | % | 3.99 | % | ||||||||||
| Auto Finance: |
||||||||||||||||||||
| Net Interest income |
249,507 | $ | 207,379 | $ | 205,385 | $ | 195,974 | $ | 189,199 | |||||||||||
| Non-interest income |
11,339 | 13,690 | 20,926 | 22,666 | 23,430 | |||||||||||||||
| Provision for loan losses |
92,313 | 88,408 | 56,483 | 54,908 | 80,182 | |||||||||||||||
| Non-interest expenses |
113,765 | 93,482 | 83,401 | 81,345 | 84,533 | |||||||||||||||
| Income tax provision (benefit) |
19,169 | 14,104 | 31,114 | 29,659 | 17,249 | |||||||||||||||
| Net income (loss) |
$ | 35,599 | $ | 25,075 | $ | 55,313 | $ | 52,728 | $ | 30,665 | ||||||||||
| Loans receivable |
$ | 13,292,953 | $ | 9,997,497 | $ | 9,734,254 | $ | 9,383,432 | $ | 8,833,929 | ||||||||||
| Net charge-off rate |
2.89 | % | 3.87 | % | 2.63 | % | 2.53 | % | 4.13 | % | ||||||||||
| Delinquency Rate (30+ days) |
3.51 | % | 5.50 | % | 5.54 | % | 5.59 | % | 5.44 | % | ||||||||||
| Global Financial Services: |
||||||||||||||||||||
| Net Interest income |
$ | 412,733 | $ | 390,262 | $ | 361,165 | $ | 338,192 | $ | 331,889 | ||||||||||
| Non-interst income |
233,841 | 240,781 | 240,597 | 185,488 | 177,326 | |||||||||||||||
| Provision for loan losses |
188,316 | 220,253 | 150,921 | 159,001 | 153,436 | |||||||||||||||
| Non-interest expenses |
351,476 | 368,020 | 322,552 | 295,117 | 279,860 | |||||||||||||||
| Income tax provision (benefit) |
36,309 | 13,561 | 41,445 | 23,471 | 24,984 | |||||||||||||||
| Net income (loss) |
$ | 70,473 | $ | 29,209 | $ | 86,844 | $ | 46,091 | $ | 50,935 | ||||||||||
| Loans receivable |
$ | 21,683,102 | $ | 21,240,325 | $ | 19,614,693 | $ | 18,722,812 | $ | 17,642,995 | ||||||||||
| Net charge-off rate |
3.55 | % | 3.30 | % | 3.26 | % | 3.43 | % | 3.60 | % | ||||||||||
| Delinquency Rate (30+ days) |
3.04 | % | 2.81 | % | 2.65 | % | 2.50 | % | 2.63 | % | ||||||||||
| Other: |
||||||||||||||||||||
| Net Interest income |
$ | (94,118 | ) | $ | (54,587 | ) | $ | (68,630 | ) | $ | (72,795 | ) | $ | (44,587 | ) | |||||
| Non-interst income |
46,806 | 21,496 | 26,785 | (12,890 | ) | 44,724 | ||||||||||||||
| Provision for loan losses |
3,627 | 3,277 | 12,593 | (1,535 | ) | (8,771 | ) | |||||||||||||
| Non-interest expenses |
26,449 | 78,641 | 72,848 | 31,926 | 30,578 | |||||||||||||||
| Income tax provision (benefit) |
(19,709 | ) | (53,908 | ) | (60,858 | ) | (40,555 | ) | (4,041 | ) | ||||||||||
| Net income (loss) |
$ | (57,679 | ) | $ | (61,101 | ) | $ | (66,428 | ) | $ | (75,521 | ) | $ | (17,629 | ) | |||||
| Loans receivable |
$ | (13,826 | ) | $ | 13,906 | $ | 25,917 | $ | 13,664 | $ | 42,019 | |||||||||
| Total: |
||||||||||||||||||||
| Net Interest income |
$ | 1,818,760 | $ | 1,701,827 | $ | 1,670,367 | $ | 1,585,470 | $ | 1,677,078 | ||||||||||
| Non-interst income |
1,071,401 | 1,098,979 | 1,099,773 | 1,011,298 | 1,014,536 | |||||||||||||||
| Provision for loan losses |
773,292 | 961,800 | 723,176 | 731,943 | 760,126 | |||||||||||||||
| Non-interest expenses |
1,327,832 | 1,556,527 | 1,311,984 | 1,228,812 | 1,224,896 | |||||||||||||||
| Income tax provision (benefit) |
282,475 | 87,351 | 244,819 | 228,626 | 255,786 | |||||||||||||||
| Net income (loss) |
$ | 506,562 | $ | 195,128 | $ | 490,161 | $ | 407,387 | $ | 450,806 | ||||||||||
| Loans receivable |
$ | 81,591,992 | $ | 79,861,299 | $ | 75,456,831 | $ | 73,367,352 | $ | 71,816,902 | ||||||||||
| Net charge-off rate |
4.13 | % | 4.37 | % | 4.05 | % | 4.42 | % | 4.83 | % | ||||||||||
| Delinquency Rate (30+ days) |
3.45 | % | 3.82 | % | 3.90 | % | 3.76 | % | 3.80 | % | ||||||||||
| (1) | The information in this statistical summary reflects the adjustment to add back the effect of securitization transactions qualifying as sales under generally accepted accounting principles. See accompanying schedule - “Reconciliation to GAAP Financial Measures”. |
CAPITAL ONE FINANCIAL CORPORATION
Reconciliation to GAAP Financial Measures
For the Three Months Ended March 31, 2005
(dollars in thousands)(unaudited)
The Company’s consolidated financial statements prepared in accordance with generally accepted accounting principles (“GAAP”) are referred to as its “reported” financial statements. Loans included in securitization transactions which qualified as sales under GAAP have been removed from the Company’s “reported” balance sheet. However, servicing fees, finance charges, and other fees, net of charge-offs, and interest paid to investors of securitizations are recognized as servicing and securitizations income on the “reported” income statement.
The Company’s “managed” consolidated financial statements reflect adjustments made related to effects of securitization transactions qualifying as sales under GAAP. The Company generates earnings from its “managed” loan portfolio which includes both the on-balance sheet loans and off-balance sheet loans. The Company’s “managed” income statement takes the components of the servicing and securitizations income generated from the securitized portfolio and distributes the revenue and expense to appropriate income statement line items from which it originated. For this reason the Company believes the “managed” consolidated financial statements and related managed metrics to be useful to stakeholders.
| Total Reported |
Adjustments(1) |
Total Managed(2) | ||||||||
| Income Statement Measures |
||||||||||
| Net interest income |
$ | 860,521 | $ | 958,239 | $ | 1,818,760 | ||||
| Non-interest income |
$ | 1,515,979 | $ | (444,578 | ) | $ | 1,071,401 | |||
| Total revenue |
$ | 2,376,500 | $ | 513,661 | $ | 2,890,161 | ||||
| Provision for loan losses |
$ | 259,631 | $ | 513,661 | $ | 773,292 | ||||
| Net charge-offs |
$ | 330,270 | $ | 513,661 | $ | 843,931 | ||||
| Balance Sheet Measures |
||||||||||
| Consumer loans |
$ | 37,959,203 | $ | 43,632,789 | $ | 81,591,992 | ||||
| Total assets |
$ | 55,631,566 | $ | 43,092,298 | $ | 98,723,864 | ||||
| Average consumer loans |
$ | 38,203,914 | $ | 43,448,571 | $ | 81,652,485 | ||||
| Average earning assets |
$ | 50,897,655 | $ | 41,579,833 | $ | 92,477,488 | ||||
| Average total assets |
$ | 56,287,734 | $ | 42,995,109 | $ | 99,282,843 | ||||
| Delinquencies |
$ | 1,318,958 | $ | 1,493,153 | $ | 2,812,111 | ||||
| (1) | Includes adjustments made related to the effects of securitization transactions qualifying as sales under GAAP and adjustments made to reclassify to “managed” loans outstanding the collectible portion of billed finance charge and fee income on the investors’ interest in securitized loans excluded from loans outstanding on the “reported” balance sheet in accordance with Financial Accounting Standards Board Staff Position, “Accounting for Accrued Interest Receivable Related to Securitized and Sold Receivables under FASB Statement 140, Accounting for Transfers and Servicing of Financial Assets and Extinguishments of Liabilities”, issued April 2003. |
| (2) | The Managed loan portfolio does not include auto loans which have been sold in whole loan sale transactions where the Company has retained servicing rights. |
CAPITAL ONE FINANCIAL CORPORATION
Consolidated Balance Sheets
(in thousands)(unaudited)
| March 31 2005 |
December 31 2004 |
March 31 2004 |
|||||||||
| Assets: |
|||||||||||
| Cash and due from banks |
$ | 761,234 | $ | 327,517 | 323,346 | ||||||
| Federal funds sold and resale agreements |
12,283 | 773,695 | 1,257,666 | ||||||||
| Interest-bearing deposits at other banks |
446,793 | 309,999 | 188,237 | ||||||||
| Cash and cash equivalents |
1,220,310 | 1,411,211 | 1,769,249 | ||||||||
| Securities available for sale |
9,460,688 | 9,300,454 | 9,149,440 | ||||||||
| Consumer loans |
37,959,203 | 38,215,591 | 33,171,516 | ||||||||
| Less: Allowance for loan losses |
(1,440,000 | ) | (1,505,000 | ) | (1,495,000 | ) | |||||
| Net loans |
36,519,203 | 36,710,591 | 31,676,516 | ||||||||
| Accounts receivable from securitizations |
5,605,009 | 4,081,271 | 4,008,809 | ||||||||
| Premises and equipment, net |
806,411 | 817,704 | 898,802 | ||||||||
| Interest receivable |
259,350 | 252,857 | 236,852 | ||||||||
| Other |
1,760,595 | 1,173,167 | 1,406,757 | ||||||||
| Total assets |
$ | 55,631,566 | $ | 53,747,255 | 49,146,425 | ||||||
| Liabilities: |
|||||||||||
| Interest-bearing deposits |
$ | 25,854,025 | $ | 25,636,802 | 23,610,851 | ||||||
| Senior and subordinated notes |
6,876,432 | 6,874,790 | 7,224,798 | ||||||||
| Other borrowings |
10,243,235 | 9,637,019 | 8,254,383 | ||||||||
| Interest payable |
242,464 | 237,227 | 245,172 | ||||||||
| Other |
3,435,680 | 2,973,228 | 2,968,993 | ||||||||
| Total liabilities |
46,651,836 | 45,359,066 | 42,304,197 | ||||||||
| Stockholders’ Equity: |
|||||||||||
| Common stock |
2,536 | 2,484 | 2,411 | ||||||||
| Paid-in capital, net |
2,878,237 | 2,711,327 | 2,218,861 | ||||||||
| Retained earnings and cumulative other comprehensive income |
6,166,070 | 5,741,131 | 4,670,384 | ||||||||
| Less: Treasury stock, at cost |
(67,113 | ) | (66,753 | ) | (49,428 | ) | |||||
| Total stockholders’ equity |
8,979,730 | 8,388,189 | 6,842,228 | ||||||||
| Total liabilities and stockholders’ equity |
$ | 55,631,566 | $ | 53,747,255 | 49,146,425 | ||||||
CAPITAL ONE FINANCIAL CORPORATION
Consolidated Statements of Income
(in thousands, except per share data)(unaudited)
| Three Months Ended | |||||||||
| March 31 2005 |
December 31 2004 |
March 31 2004 | |||||||
| Interest Income: |
|||||||||
| Consumer loans, including past-due fees |
$ | 1,184,036 | $ | 1,097,041 | 1,035,017 | ||||
| Securities available for sale |
90,164 | 88,085 | 63,716 | ||||||
| Other |
62,068 | 64,204 | 65,998 | ||||||
| Total interest income |
1,336,268 | 1,249,330 | 1,164,731 | ||||||
| Interest Expense: |
|||||||||
| Deposits |
264,025 | 267,706 | 239,512 | ||||||
| Senior and subordinated notes |
114,480 | 116,419 | 124,418 | ||||||
| Other borrowings |
97,242 | 80,641 | 68,779 | ||||||
| Total interest expense |
475,747 | 464,766 | 432,709 | ||||||
| Net interest income |
860,521 | 784,564 | 732,022 | ||||||
| Provision for loan losses |
259,631 | 467,133 | 243,668 | ||||||
| Net interest income after provision for loan losses |
600,890 | 317,431 | 488,354 | ||||||
| Non-Interest Income: |
|||||||||
| Servicing and securitizations |
951,602 | 915,511 | 917,669 | ||||||
| Service charges and other customer-related fees |
401,186 | 374,048 | 354,493 | ||||||
| Interchange |
123,440 | 135,843 | 105,595 | ||||||
| Other |
39,751 | 96,173 | 65,377 | ||||||
| Total non-interest income |
1,515,979 | 1,521,575 | 1,443,134 | ||||||
| Non-Interest Expense: |
|||||||||
| Salaries and associate benefits |
433,501 | 382,646 | 424,392 | ||||||
| Marketing |
311,759 | 511,142 | 255,147 | ||||||
| Communications and data processing |
142,819 | 137,867 | 117,106 | ||||||
| Supplies and equipment |
86,446 | 92,827 | 88,321 | ||||||
| Occupancy |
17,901 | 55,994 | 38,719 | ||||||
| Other |
335,406 | 376,051 | 301,211 | ||||||
| Total non-interest expense |
1,327,832 | 1,556,527 | 1,224,896 | ||||||
| Income before income taxes |
789,037 | 282,479 | 706,592 | ||||||
| Income taxes |
282,475 | 87,351 | 255,786 | ||||||
| Net income |
$ | 506,562 | $ | 195,128 | $ | 450,806 | |||
| Basic earnings per share |
$ | 2.08 | $ | 0.82 | $ | 1.94 | |||
| Diluted earnings per share |
$ | 1.99 | $ | 0.77 | $ | 1.84 | |||
| Dividends paid per share |
$ | 0.03 | $ | 0.03 | $ | 0.03 | |||
CAPITAL ONE FINANCIAL CORPORATION
Statements of Average Balances, Income and Expense, Yields and Rates
(dollars in thousands)(unaudited)
| Reported | Quarter Ended 3/31/05 |
Quarter Ended 12/31/04 |
Quarter Ended 3/31/04 |
||||||||||||||||||||||||
| Average Balance |
Income/ Expense |
Yield/ Rate |
Average Balance |
Income/ Expense |
Yield/ Rate |
Average Balance |
Income/ Expense |
Yield/ Rate |
|||||||||||||||||||
| Earning assets: |
|||||||||||||||||||||||||||
| Consumer loans |
$ | 38,203,914 | $ | 1,184,036 | 12.40 | % | $ | 36,096,481 | $ | 1,097,041 | 12.16 | % | $ | 32,877,525 | $ | 1,035,017 | 12.59 | % | |||||||||
| Securities available for sale |
9,654,437 | 90,164 | 3.74 | % | 9,741,355 | 88,085 | 3.62 | % | 7,098,951 | 63,716 | 3.59 | % | |||||||||||||||
| Other |
3,039,304 | 62,068 | 8.17 | % | 3,662,512 | 64,204 | 7.01 | % | 4,135,065 | 65,998 | 6.38 | % | |||||||||||||||
| Total earning assets |
$ | 50,897,655 | $ | 1,336,268 | 10.50 | % | $ | 49,500,348 | $ | 1,249,330 | 10.10 | % | $ | 44,111,541 | $ | 1,164,731 | 10.56 | % | |||||||||
| Interest-bearing liabilities: |
|||||||||||||||||||||||||||
| Deposits |
$ | 25,654,741 | $ | 264,025 | 4.12 | % | $ | 25,580,044 | $ | 267,706 | 4.19 | % | $ | 22,992,712 | $ | 239,512 | 4.17 | % | |||||||||
| Senior and subordinated notes |
6,908,505 | 114,480 | 6.63 | % | 6,946,109 | 116,419 | 6.70 | % | 7,270,889 | 124,418 | 6.84 | % | |||||||||||||||
| Other borrowings |
10,698,085 | 97,242 | 3.64 | % | 9,076,531 | 80,641 | 3.55 | % | 7,834,046 | 68,779 | 3.51 | % | |||||||||||||||
| Total interest-bearing liabilities |
$ | 43,261,331 | $ | 475,747 | 4.40 | % | $ | 41,602,684 | $ | 464,766 | 4.47 | % | $ | 38,097,647 | $ | 432,709 | 4.54 | % | |||||||||
| Net interest spread |
6.10 | % | 5.63 | % | 6.02 | % | |||||||||||||||||||||
| Interest income to average earning assets |
10.50 | % | 10.10 | % | 10.56 | % | |||||||||||||||||||||
| Interest expense to average earning assets |
3.74 | % | 3.76 | % | 3.92 | % | |||||||||||||||||||||
| Net interest margin |
6.76 | % | 6.34 | % | 6.64 | % | |||||||||||||||||||||
7
CAPITAL ONE FINANCIAL CORPORATION
Statements of Average Balances, Income and Expense, Yields and Rates
(dollars in thousands)(unaudited)
| Managed (1) | Quarter Ended 3/31/05 |
Quarter Ended 12/31/04 |
Quarter Ended 3/31/04 |
||||||||||||||||||||||||
| Average Balance |
Income/ Expense |
Yield/ Rate |
Average Balance |
Income/ Expense |
Yield/ Rate |
Average Balance |
Income/ Expense |
Yield/ Rate |
|||||||||||||||||||
| Earning assets: |
|||||||||||||||||||||||||||
| Consumer loans |
$ | 81,652,485 | $ | 2,631,751 | 12.89 | % | $ | 76,929,973 | $ | 2,476,365 | 12.88 | % | $ | 71,148,287 | $ | 2,405,738 | 13.53 | % | |||||||||
| Securities available for sale |
9,654,437 | 90,164 | 3.74 | % | 9,741,355 | 88,085 | 3.62 | % | 7,098,951 | 63,716 | 3.59 | % | |||||||||||||||
| Other |
1,170,566 | 17,672 | 6.04 | % | 1,789,742 | 16,940 | 3.79 | % | 2,247,996 | 13,056 | 2.32 | % | |||||||||||||||
| Total earning assets |
$ | 92,477,488 | $ | 2,739,587 | 11.85 | % | $ | 88,461,070 | $ | 2,581,390 | 11.67 | % | $ | 80,495,234 | $ | 2,482,510 | 12.34 | % | |||||||||
| Interest-bearing liabilities: |
|||||||||||||||||||||||||||
| Deposits |
$ | 25,654,741 | $ | 264,025 | 4.12 | % | $ | 25,580,044 | $ | 267,706 | 4.19 | % | $ | 22,992,712 | $ | 239,512 | 4.17 | % | |||||||||
| Senior and subordinated notes |
6,908,505 | 114,480 | 6.63 | % | 6,946,109 | 116,419 | 6.70 | % | 7,270,889 | 124,418 | 6.84 | % | |||||||||||||||
| Other borrowings |
10,698,085 | 97,242 | 3.64 | % | 9,076,531 | 80,641 | 3.55 | % | 7,834,046 | 68,779 | 3.51 | % | |||||||||||||||
| Securitization liability |
43,215,671 | 445,080 | 4.12 | % | 40,291,395 | 414,797 | 4.12 | % | 37,669,211 | 372,723 | 3.96 | % | |||||||||||||||
| Total interest-bearing liabilities |
$ | 86,477,002 | $ | 920,827 | 4.26 | % | $ | 81,894,079 | $ | 879,563 | 4.30 | % | $ | 75,766,858 | $ | 805,432 | 4.25 | % | |||||||||
| Net interest spread |
7.59 | % | 7.37 | % | 8.09 | % | |||||||||||||||||||||
| Interest income to average earning assets |
11.85 | % | 11.67 | % | 12.34 | % | |||||||||||||||||||||
| Interest expense to average earning assets |
3.98 | % | 3.97 | % | 4.01 | % | |||||||||||||||||||||
| Net interest margin |
7.87 | % | 7.70 | % | 8.33 | % | |||||||||||||||||||||
| (1) | The information in this table reflects the adjustment to add back the effect of securitized loans. |
8
|
| ||||||||

|
|
FOR IMMEDIATE RELEASE: April 20, 2005 | |||||||
| Contacts: |
Investor Relations | Media Relations | ||||||
| Mike Rowen (703) 720-3203 |
Tatiana Stead (703) 720-2352 |
Julie Rakes (804) 284-5800 | ||||||
|
Capital One Reports First Quarter Earnings Company reaffirms EPS Guidance for 2005 of $6.60 to $7.00
McLean, Va. (April 20, 2005) – Capital One Financial Corporation (NYSE: COF) today announced that its earnings for the first quarter of 2005 were $506.6 million, or $1.99 per share (diluted), compared with $450.8 million, or $1.84 per share, for the first quarter of 2004, and $195.1 million, or $.77 per share, in the fourth quarter of 2004.
“The company’s first quarter results reflect strong performance in our US Card business as well as continued success in our Auto Finance and Global Financial Services businesses,” said Richard D. Fairbank, Capital One’s Chairman and Chief Executive Officer. “Additionally, the acquisition of Hibernia Corporation, which we announced in March, will enhance our diversification efforts and growth prospects, while lowering our funding costs and overall risk profile.”
Managed loans grew to $81.6 billion as of March 31, 2005, up $1.7 billion, or 9 percent annualized, from the previous quarter, and up $9.8 billion, or 14 percent, from the first quarter of 2004. The company continues to expect that managed loans will grow at a rate of between 12 and 15 percent during 2005, excluding the impact of the Hibernia transaction.
The managed charge-off rate decreased to 4.13 percent in the first quarter of 2005 from 4.37 percent in the previous quarter, and from 4.83 percent in the first quarter of 2004. The company now expects its quarterly managed charge-off rate to stay below 4.25 percent in 2005, with seasonal variations and excluding the impact of the Hibernia transaction.
The company decreased its allowance for loan losses in the first quarter of 2005 by $65.0 million. The reduction was driven largely by seasonality of loan growth and credit metrics. The company continues to expect a net increase in its allowance for loan losses in the full year 2005, inclusive of the first quarter reduction and excluding the impact of the Hibernia transaction. The managed delinquency rate (30+ days) decreased to 3.45 percent as of March 31, 2005 from 3.82 percent as of the end of the previous quarter. The managed delinquency rate as of March 31, 2004 was 3.80 percent. | ||||||||

-more-
Capital One Reports First Quarter Earnings
Page 2
“Solid revenue growth, improvements in operating efficiency, and strong credit performance across our business keeps us on track to deliver diluted earnings of between $6.60 and $7.00 per share in 2005,” said Gary L. Perlin, Capital One’s Chief Financial Officer. This earnings guidance incorporates the expected impact of completing the acquisition of Hibernia Corporation in the third quarter of 2005, and includes pro rata 2005 earnings for Hibernia Corporation as estimated by I/B/E/S as of March 4, 2005.
Capital One’s managed revenue margin decreased to 12.50 percent in the first quarter of 2005 from 12.66 percent in the previous quarter, in line with our bias towards lower loss assets. The company’s managed revenue margin was 13.38 percent in the first quarter of 2004.
Marketing expenses for the first quarter of 2005 were $311.8 million, down $199.3 million from the $511.1 million spent in the fourth quarter of 2004. Marketing expenses were $255.1 million in the comparable quarter of the prior year. The company continues to expect annual marketing spend for 2005 to be similar to 2004, excluding the impact of the Hibernia transaction.
Annualized operating expenses as a percentage of average managed loans decreased to 4.98 percent in the first quarter of 2005, down from 5.44 percent in the previous quarter and 5.45 percent in the first quarter of 2004. Included in first quarter 2005 operating expenses were charges totaling $23.7 million for a combination of employee termination benefits and continued facility consolidations, as well as an $18.8 million reversal of a previously recognized impairment related to the sale of the Tampa, FL facility. The company expects about $40 million in additional restructuring charges in 2005 related to programs initiated in 2004.
The company continues to expect a return on managed assets of between 1.7 and 1.8 percent in 2005, with some quarterly variability, excluding the impact of the Hibernia transaction. The company expects that modest declines in its managed revenue margin will be more than offset by improvements in expenses as a percentage of managed loans.
During the first quarter of 2005, Capital One completed the acquisitions of Hfs Group, Onyx, InsLogic, and eSmartloan. Capital One also announced a definitive agreement to acquire Hibernia Corporation (NYSE: HIB) in a stock and cash transaction valued at approximately $5.3 billion. The transaction is subject to regulatory and Hibernia shareholder approvals and is expected to be completed in the third quarter of 2005.
The company generates earnings from its managed loan portfolio, which includes both on-balance sheet loans and securitized (off-balance sheet) loans. For this reason, the company believes managed financial measures to be useful to stakeholders. In compliance with Regulation G of the Securities and Exchange Commission, the company is providing a numerical reconciliation of managed financial measures to comparable measures calculated on a reported basis using generally accepted accounting
-more-
Capital One Reports First Quarter Earnings
Page 3
principles (GAAP). Please see the schedule titled “Reconciliation to GAAP Financial Measures” attached to this release for more information.
The company cautions that its current expectations in this release, in the presentation slides available on the company’s website and on its Form 8-K dated April 20, 2005 for 2005 earnings, charge-off rates, revenue margins, return on assets, allowance for loan losses, loan growth rates, marketing, the composition of loan growth, restructuring charges, the benefits of the business combination transaction involving Capital One and Hibernia, including future financial and operating results, and the new company’s plans, objectives, expectations and intentions are forward-looking statements and actual results could differ materially from current expectations due to a number of factors, including: continued intense competition from numerous providers of products and services which compete with our businesses; changes in our aggregate accounts and balances, and the growth rate and composition thereof; the company’s ability to continue to diversify its assets; the company’s ability to access the capital markets at attractive rates and terms to fund its operations and future growth; changes in the reputation of the credit card industry and/or the company with respect to practices or products; the success of the company’s marketing efforts; the company’s ability to execute effective tax planning strategies; the company’s ability to execute on its strategic and operating plans; and general economic conditions affecting consumer income and spending, which may affect consumer bankruptcies, defaults, and charge-offs; the ability to obtain regulatory approvals of the proposed Capital One - Hibernia transaction on the proposed terms and schedule; the failure of Hibernia stockholders to approve the transaction; the risk that the businesses will not be integrated successfully; the risk that the cost savings and any other synergies from the transaction may not be fully realized or may take longer to realize than expected; and disruption from the transaction making it more difficult to maintain relationships with customers, employees or suppliers.
A discussion of these and other factors can be found in Capital One’s annual report and other reports filed with the Securities and Exchange Commission, including, but not limited to, Capital One’s report on Form 10-K for the fiscal year ended December 31, 2004.
Additional Information About the Capital One - Hibernia Transaction
In connection with the proposed merger between Capital One and Hibernia, Capital One and Hibernia will file with the Securities and Exchange Commission (the “SEC”) a Registration Statement on Form S-4 that will include a proxy statement of Hibernia that also constitutes a prospectus of Capital One. Hibernia will mail the proxy statement/prospectus to its stockholders. Investors and
-more-
Capital One Reports First Quarter Earnings
Page 4
security holders are urged to read the proxy statement/prospectus regarding the proposed merger when it becomes available because it will contain important information. A free copy of the proxy statement/prospectus (when available) and other related documents filed by Capital One and Hibernia with the SEC may be obtained at the SEC’s website at www.sec.gov. The proxy statement/prospectus (when it is available) and the other documents may also be obtained for free by accessing Capital One’s website at www.capitalone.com under the tab “Investors” and then under the heading “SEC & Regulatory Filings” or by accessing Hibernia’s website at www.hibernia.com under the tab “About Hibernia” and then under the heading “Investor Relations—SEC Filings.”
Capital One, Hibernia and their respective directors, executive officers and certain other members of management and employees may be soliciting proxies from Hibernia stockholders in favor of the merger. Information regarding the persons who may, under the rules of the SEC, be considered participants in the solicitation of the Hibernia stockholders in connection with the proposed merger will be set forth in the proxy statement/prospectus when it is filed with the SEC. You can find information about Capital One’s executive officers and directors in its definitive proxy statement filed with the SEC on March 21, 2005. You can find information about Hibernia’s executive officers and directors in its definitive proxy statement filed with the SEC on March 15, 2005. You can obtain free copies of these documents from Capital One and Hibernia using the contact information above.
About Capital One
Headquartered in McLean, Virginia, Capital One Financial Corporation (www.capitalone.com) is a bank holding company whose principal subsidiaries, Capital One Bank, Capital One, F.S.B. and Capital One Auto Finance, Inc. offer a variety of consumer lending products. Capital One’s subsidiaries collectively had 49.1 million accounts and $81.6 billion in managed loans outstanding as of March 31, 2005. Capital One is a Fortune 500 company and, through its subsidiaries, is one of the largest providers of MasterCard and Visa credit cards in the world. Capital One trades on the New York Stock Exchange under the symbol “COF” and is included in the S&P 500 index
###
NOTE: First quarter 2005 financial results, SEC Filings, and first quarter earnings conference call slides are accessible on Capital One’s home page (www.capitalone.com). Choose “Investors” on the bottom right corner of the home page to view and download the earnings press release, slides, and other financial information. Additionally, a webcast of today’s 5:00 pm (EST) earnings conference call is accessible through the same link.
April 20, 2005

Forward-Looking Information
Forward-Looking Information
Please note that the following materials containing information regarding Capital One’s financial performance speak only as of the particular date or dates indicated in these materials. Capital One does not undertake any obligation to update or revise any of the information contained herein whether as a result of new information, future events or otherwise.
Certain statements in this presentation and other oral and written statements made by the Company from time to time, are forward-looking statements, including those that discuss strategies, goals, outlook or other non-historical matters including the benefits of the business combination transaction involving Capital One and Hibernia Corporation and the new company’s plans, objectives, expectations, and intentions; or project revenues, income, returns, earnings per share or other financial measures for Capital One or the new company. To the extent any such information is forward-looking, it is intended to fit within the safe harbor for forward-looking information provided by the Private Securities Litigation Reform Act of 1995. Numerous factors could cause our actual results to differ materially from those described in forward-looking statements, including, among other things: continued intense competition from numerous providers of products and services which compete with our businesses; an increase or decrease in credit losses; financial, legal, regulatory or accounting changes or actions; changes in interest rates; general economic conditions affecting consumer income, spending and repayments; changes in our aggregate accounts or consumer loan balances and the growth rate and composition thereof; changes in the reputation of the credit card industry and/or the company with respect to practices and products; our ability to continue to securitize our credit cards and consumer loans and to otherwise access the capital markets at attractive rates and terms to fund our operations and future growth; our ability to successfully continue to diversify our assets; losses associated with new products or services or expansion internationally; the company’s ability to execute on its strategic and operational plans; any significant disruption in our operations or technology platform; our ability to effectively control our costs; the success of marketing efforts; our ability to execute effective tax planning strategies; our ability to recruit and retain experienced management personnel; the ability to obtain regulatory approvals of the Capital One - Hibernia transaction on the proposed terms and schedule; the failure of Hibernia stockholders to approve the transaction; the risk that the businesses will not be integrated successfully; the risk that the cost savings and any other synergies from the transaction may not be fully realized or may take longer to realize than expected; disruption from the transaction making it more difficult to maintain relationships with customers, employees or suppliers; and other factors listed from time to time in reports we file with the Securities and Exchange Commission (the “SEC”), including, but not limited to, factors set forth under the caption “Risk Factors” in our Annual Report on Form 10-K for the year ended December 31, 2004, and any subsequent quarterly reports on Form 10-Q. You should carefully consider the factors discussed above in evaluating these forward-looking statements. All information in these slides is based on the consolidated results of Capital One Financial Corporation. Further information about Capital One can be obtained from the Corporation’s public filings with the SEC. A reconciliation of any non-GAAP financial measures included in this presentation can be found in the Company’s most recent Form 8-K or Form 10-Q concerning quarterly financial results, available on the Company’s website at www.capitalone.com in Investor Relations under “About Capital One.” based on new information or otherwise.
Additional Information About the Capital One - Hibernia Transaction
In connection with the proposed merger between Capital One and Hibernia Corporation, Capital One will file with the Securities and Exchange Commission (the “SEC”) a Registration Statement on Form S-4 that will include a proxy statement of Hibernia that also constitutes a prospectus of Capital One. Hibernia will mail the proxy statement/prospectus to its stockholders. Investors and security holders are urged to read the proxy statement/prospectus regarding the proposed merger when it becomes available because it will contain important information. You may obtain a free copy of the proxy statement/prospectus (when available) and other related documents filed by Capital One and Hibernia with the SEC at the SEC’s website at www.sec.gov. The proxy statement/prospectus (when it is available) and the other documents may also be obtained for free by accessing Capital One’s website at www.capitalone.com under the tab “Investors” and then under the heading “SEC & Regulatory Filings” or by accessing Hibernia’s website at www.hibernia.com under the tab “About Hibernia” and then under the heading “Investor Relations—SEC Filings”.
Capital One, Hibernia and their respective directors, executive officers and certain other members of management and employees may be soliciting proxies from Hibernia stockholders in favor of the merger. Information regarding the persons who may, under the rules of the SEC, be considered participants in the solicitation of the
Hibernia stockholders in connection with the proposed merger will be set forth in the proxy statement/prospectus when it is filed with the SEC. You can find information about
Capital One’s executive officers and directors in its definitive proxy statement filed with the SEC on March 21, 2005. You can find information about Hibernia’s executive officers and directors in its definitive proxy statement filed with the SEC on March 15, 2005. You can obtain free copies of these documents from Capital One and Hibernia using the contact information above.
2
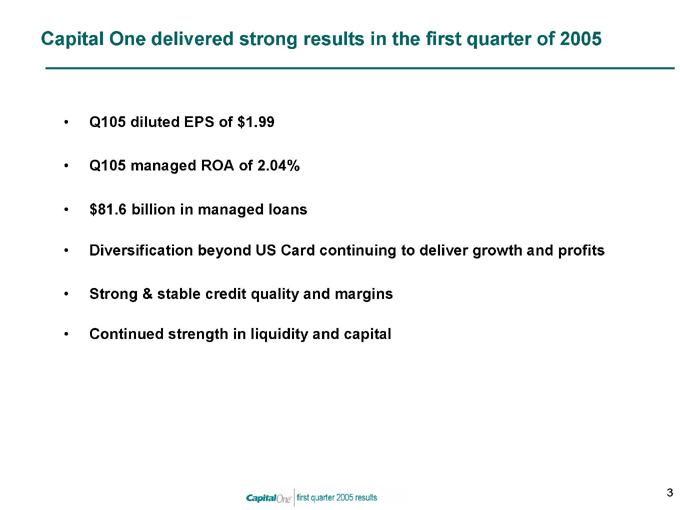
Capital One delivered strong results in the first quarter of 2005
Q105 diluted EPS of $1.99
Q105 managed ROA of 2.04%
$81.6 billion in managed loans
Diversification beyond US Card continuing to deliver growth and profits
Strong & stable credit quality and margins
Continued strength in liquidity and capital
3
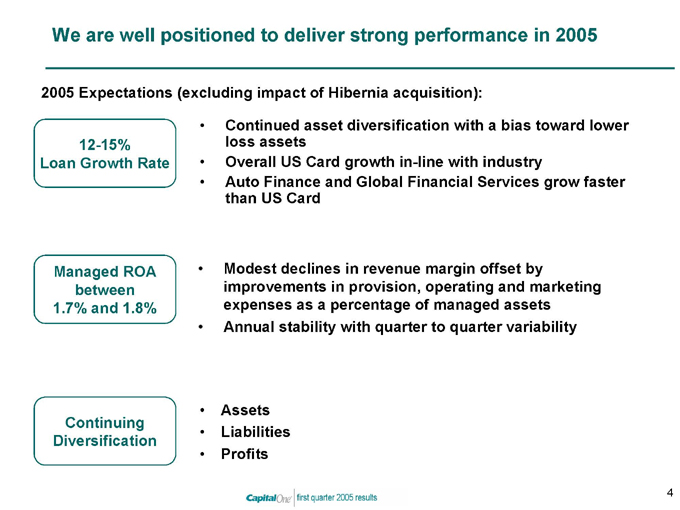
We are well positioned to deliver strong performance in 2005
2005 Expectations (excluding impact of Hibernia acquisition):
12-15% Loan Growth Rate
Continued asset diversification with a bias toward lower loss assets
Overall US Card growth in-line with industry
Auto Finance and Global Financial Services grow faster than US Card
Managed ROA between 1.7% and 1.8%
Modest declines in revenue margin offset by improvements in provision, operating and marketing expenses as a percentage of managed assets
Annual stability with quarter to quarter variability
Continuing Diversification
Assets
Liabilities
Profits
4
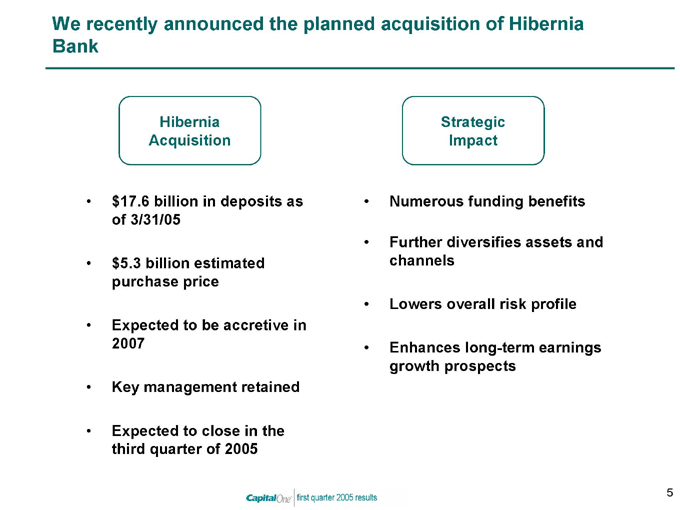
We recently announced the planned acquisition of Hibernia Bank
Hibernia Acquisition
$17.6 billion in deposits as of 3/31/05
$5.3 billion estimated purchase price
Expected to be accretive in 2007
Key management retained
Expected to close in the third quarter of 2005
Strategic Impact
Numerous funding benefits
Further diversifies assets and channels
Lowers overall risk profile
Enhances long-term earnings growth prospects
5
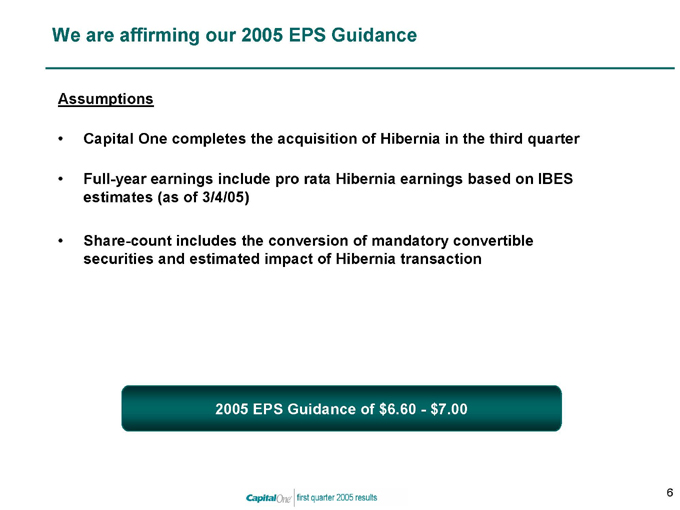
We are affirming our 2005 EPS Guidance
Assumptions
Capital One completes the acquisition of Hibernia in the third quarter
Full-year earnings include pro rata Hibernia earnings based on IBES estimates (as of 3/4/05)
Share-count includes the conversion of mandatory convertible securities and estimated impact of Hibernia transaction
2005 EPS Guidance of $6.60 - $7.00
6
First Quarter 2005
Financial Update
Segment Update
7
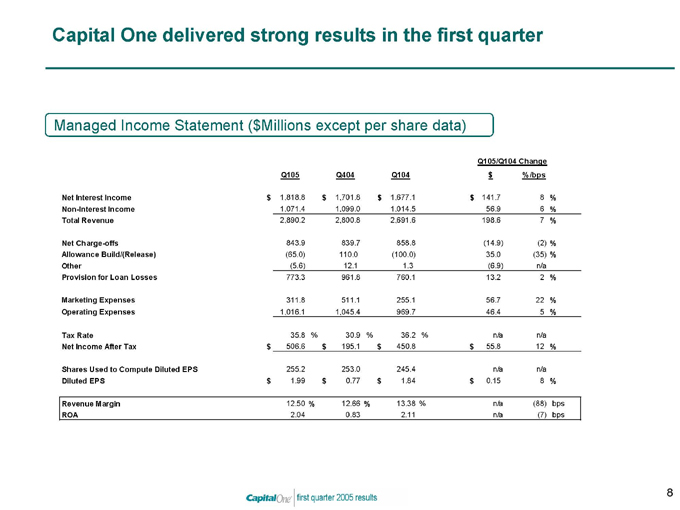
Capital One delivered strong results in the first quarter
Managed Income Statement ($Millions except per share data)
Q105/Q104 Change
Q105 Q404 Q104 $ %/bps
Net Interest Income $1,818.8 $1,701.8 $1,677.1 $141.7 8%
Non-Interest Income 1,071.4 1,099.0 1,014.5 56.9 6%
Total Revenue 2,890.2 2,800.8 2,691.6 198.6 7%
Net Charge-offs 843.9 839.7 858.8 (14.9) (2)%
Allowance Build/(Release) (65.0) 110.0 (100.0) 35.0 (35)%
Other (5.6) 12.1 1.3 (6.9) n/a
Provision for Loan Losses 773.3 961.8 760.1 13.2 2%
Marketing Expenses 311.8 511.1 255.1 56.7 22%
Operating Expenses 1,016.1 1,045.4 969.7 46.4 5%
Tax Rate 35.8% 30.9% 36.2% n/a n/a
Net Income After Tax $506.6 $195.1 $450.8 $55.8 12%
Shares Used to Compute Diluted EPS 255.2 253.0 245.4 n/a n/a
Diluted EPS $1.99 $0.77 $1.84 $0.15 8%
Revenue Margin 12.50% 12.66% 13.38% n/a (88) bps
ROA 2.04 0.83 2.11 n/a (7) bps
8
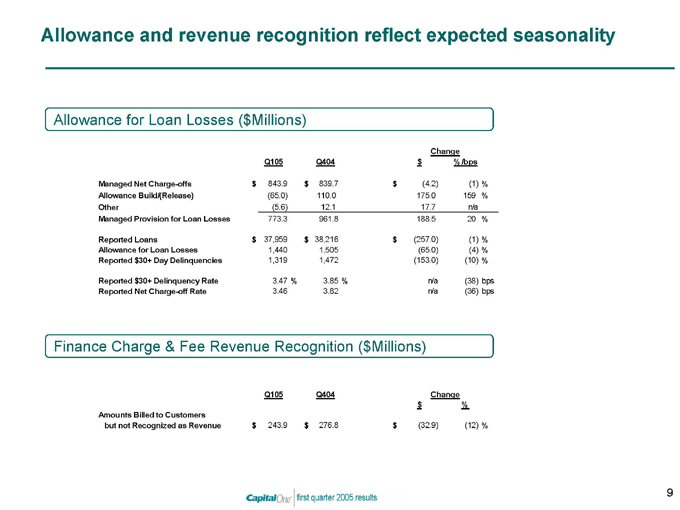
Allowance and revenue recognition reflect expected seasonality
Allowance for Loan Losses ($Millions)
Change
Q105 Q404 $ %/bps
Managed Net Charge-offs $843.9 $839.7 $(4.2) (1)%
Allowance Build/(Release) (65.0) 110.0 175.0 159%
Other (5.6) 12.1 17.7 n/a
Managed Provision for Loan Losses 773.3 961.8 188.5 20%
Reported Loans $37,959 $38,216 $(257.0) (1)%
Allowance for Loan Losses 1,440 1,505 (65.0) (4)%
Reported $30+ Day Delinquencies 1,319 1,472 (153.0) (10)%
Reported $30+ Delinquency Rate 3.47% 3.85% n/a (38) bps
Reported Net Charge-off Rate 3.46 3.82 n/a (36) bps
Finance Charge & Fee Revenue Recognition ($Millions)
Q105 Q404 Change $ %
Amounts Billed to Customers
but not Recognized as Revenue $243.9 $276.8 $(32.9) (12)%
9
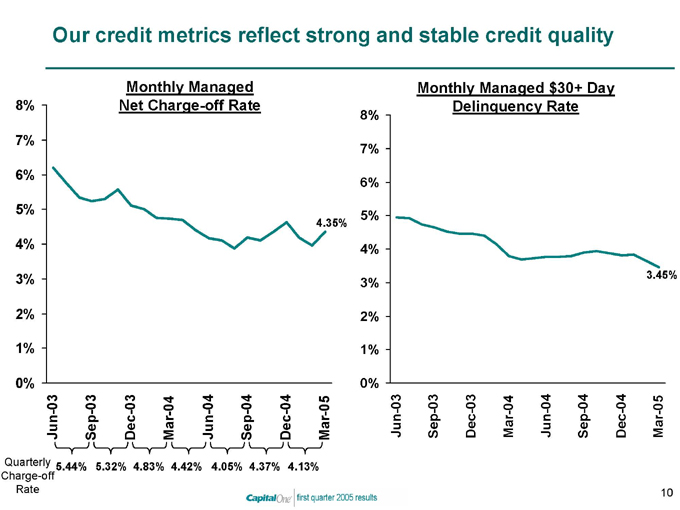
Our credit metrics reflect strong and stable credit quality
Monthly Managed Net Charge-off Rate
8% 7% 6% 5% 4% 3% 2% 1% 0%
Jun-03 Sep-03 Dec-03 Mar-04 Jun-04 Sep-04 Dec-04 Mar-05
Quarterly 5.44% 5.32% 4.83% 4.42% 4.05% 4.37% 4.13%
Charge-off Rate
4.35%
Monthly Managed $30+ Day Delinquency Rate
8% 7% 6% 5% 4% 3% 2% 1% 0%
Jun-03 Sep-03 Dec-03 Mar-04 Jun-04 Sep-04 Dec-04 Mar-05
3.45%
10
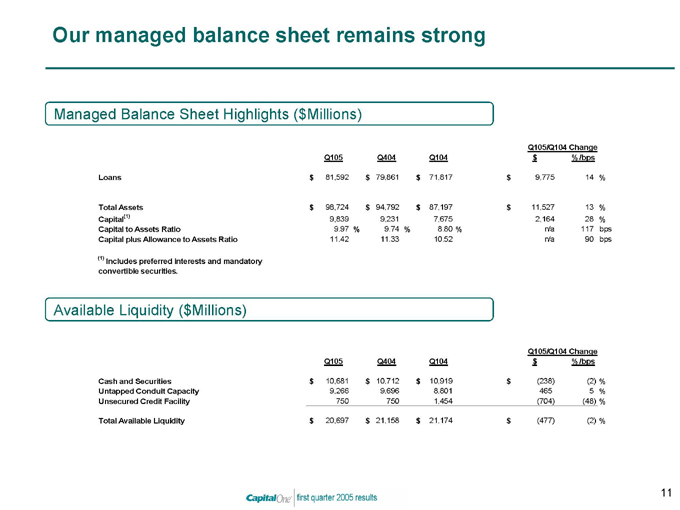
Our managed balance sheet remains strong
Managed Balance Sheet Highlights ($Millions)
Q105/Q104 Change
Q105 Q404 Q104 $ %/bps
Loans $81,592 $79,861 $71,817 $9,775 14%
Total Assets $98,724 $94,792 $87,197 $11,527 13%
Capital(1) 9,839 9,231 7,675 2,164 28%
Capital to Assets Ratio 9.97% 9.74% 8.80% n/a 117 bps
Capital plus Allowance to Assets Ratio 11.42 11.33 10.52 n/a 90 bps
(1) Includes preferred interests and mandatory
convertible securities.
Available Liquidity ($Millions)
Q105/Q104 Change
Q105 Q404 Q104 $ %/bps
Cash and Securities $10,681 $10,712 $10,919 $(238) (2)%
Untapped Conduit Capacity 9,266 9,696 8,801 465 5%
Unsecured Credit Facility 750 750 1,454 (704) (48)%
Total Available Liquidity $20,697 $21,158 $21,174 $(477) (2)%
11
First Quarter 2005
Financial Update
Segment Update
12
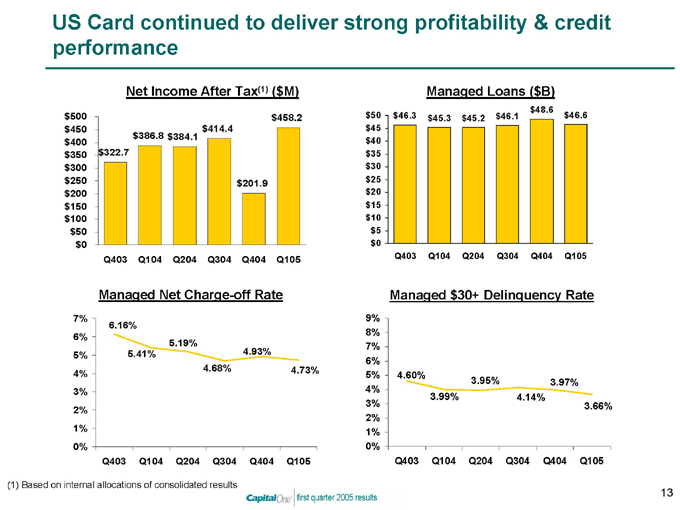
US Card continued to deliver strong profitability & credit performance
Net Income After Tax(1) ($M) $500 $450 $400 $350 $300 $250 $200 $150 $100 $50 $0
Q403 Q104 Q204 Q304 Q404 Q105 $322.7 $386.8 $384.1 $414.4 $201.9 $458.2
Managed Net Charge-off Rate
7% 6% 5% 4% 3% 2% 1% 0%
Q403 Q104 Q204 Q304 Q404 Q105
6.16%
5.41%
5.19%
4.68%
4.93%
4.73%
Managed Loans ($B) $50 $45 $40 $35 $30 $25 $20 $15 $10 $5 $0
Q403 Q104 Q204 Q304 Q404 Q105 $46.3 $45.3 $45.2 $46.1 $48.6 $46.6
Managed $30+ Delinquency Rate
9% 8% 7% 6% 5% 4% 3% 2% 1% 0%
Q403 Q104 Q204 Q304 Q404 Q105
4.60%
3.99%
3.95%
4.14%
3.97%
3.66%
(1) Based on internal allocations of consolidated results
13
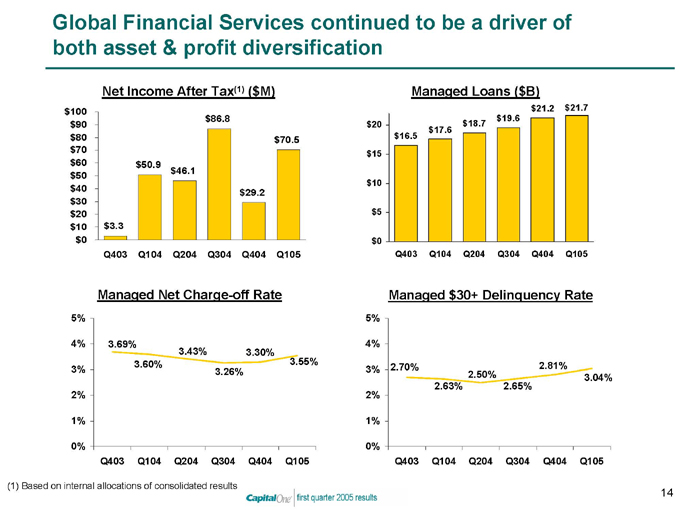
Global Financial Services continued to be a driver of both asset & profit diversification
Net Income After Tax(1) ($M) $100 $90 $80 $70 $60 $50 $40 $30 $20 $10 $0
Q403 Q104 Q204 Q304 Q404 Q105 $3.3 $50.9 $46.1 $86.8 $29.2 $70.5
Managed Net Charge-off Rate
5% 4% 3% 2% 1% 0%
Q403 Q104 Q204 Q304 Q404 Q105
3.69%
3.60%
3.43%
3.26%
3.30%
3.55%
Managed Loans ($B) $20 $15 $10 $5 $0
Q403 Q104 Q204 Q304 Q404 Q105 $16.5 $17.6 $18.7 $19.6 $21.2 $21.7
Managed $30+ Delinquency Rate
5% 4% 3% 2% 1% 0%
Q403 Q104 Q204 Q304 Q404 Q105
2.70%
2.63%
2.50%
2.65%
2.81%
3.04%
(1) Based on internal allocations of consolidated results
14
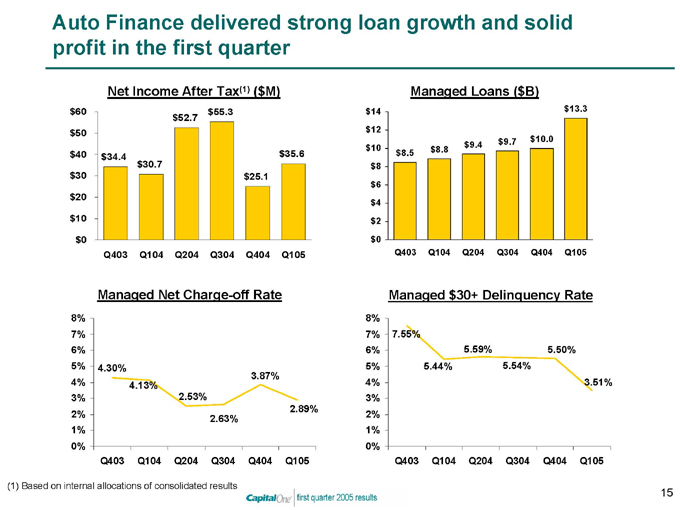
Auto Finance delivered strong loan growth and solid profit in the first quarter
Net Income After Tax(1) ($M) $60 $50 $40 $30 $20 $10 $0
Q403 Q104 Q204 Q304 Q404 Q105 $34.4 $30.7 $52.7 $55.3 $25.1 $35.6
Managed Net Charge-off Rate
8% 7% 6% 5% 4% 3% 2% 1% 0%
Q403 Q104 Q204 Q304 Q404 Q105
4.30%
4.13%
2.53%
2.63%
3.87%
2.89%
Managed Loans ($B) $14 $12 $10 $8 $6 $4 $2 $0
Q403 Q104 Q204 Q304 Q404 Q105 $8.5 $8.8 $9.4 $9.7 $10.0 $13.3
Managed $30+ Delinquency Rate
8% 7% 6% 5% 4% 3% 2% 1% 0%
Q403 Q104 Q204 Q304 Q404 Q105
7.55%
5.44%
5.59%
5.54%
5.50%
3.51%
(1) Based on internal allocations of consolidated results
15

We are delivering strong results while building a stronger company
Strong Quarter
Solid growth in loans, revenues
Strong and stable credit quality and margins
Strong balance sheet
Solid 2005 Trajectory
12-15% loan growth rate
1.7% to 1.8% managed ROA
Sustained earnings power
Lower-Risk Profile
Continuing diversification of assets, liabilities and profits
Lower-cost, more fortified funding
16