
UNITED STATES
SECURITIES AND EXCHANGE COMMISSION
Washington, DC 20549
FORM 8-K
CURRENT REPORT
Pursuant to Section 13 OR 15(d) of
The Securities Exchange Act of 1934
April 21, 2004
Date of Report (Date of earliest event reported)
CAPITAL ONE FINANCIAL CORPORATION
(Exact name of registrant as specified in its chapter)
| Delaware | 1-13300 | 54-1719854 | ||
| (State or other jurisdiction of incorporation) |
(Commission File Number) |
(IRS Employer Identification No.) |
| 1680 Capital One Drive, McLean, Virginia |
22102 | |
| (Address of principal executive offices) | (Zip Code) |
Registrant’s telephone number, including area code: (703) 720-1000
(Former name or former address, if changed since last report)
Item 5. Other Events.
| (a) | See attached press release, at Exhibit 99.1. |
| (b) | Cautionary Factors. |
The attached press release and information provided pursuant to Items 7 and 12 contain forward-looking statements, which involve a number of risks and uncertainties. The Company cautions readers that any forward-looking information is not a guarantee of future performance and that actual results could differ materially from those contained in the forward-looking information as a result of various factors including, but not limited to, the following:
| • | continued intense competition from numerous providers of products and services which compete with the Company’s businesses; |
| • | an increase in credit losses (including increases due to a worsening of general economic conditions); |
| • | the ability of the Company to continue to securitize its credit cards and consumer loans and to otherwise access the capital markets at attractive rates and terms to capitalize and fund its operations and future growth; |
| • | financial, legal, regulatory, accounting changes or actions that may affect investment in, or the overall performance of, a product or business, including changes in existing law and regulation affecting the credit card and consumer loan industry, in particular (including federal bank examiner guidance affecting credit card and/or subprime lending) and the financial services industry, in general (including the ability of financial services companies to obtain, use and share consumer data); |
| • | changes in interest rates; |
| • | general economic conditions affecting consumer income, spending and repayments which may affect consumer bankruptcies or defaults and hence delinquencies and charge-offs; |
| • | with respect to financial and other products, changes in the Company’s aggregate accounts or consumer loan balances and the growth rate and composition thereof, including changes resulting from factors such as shifting product mix, amount of actual marketing expenses made by the Company and attrition of accounts and loan balances; |
| • | changes in the reputation of the credit card industry and/or the Company with respect to practices or products; |
| • | the Company’s ability to successfully continue to diversify its assets; |
| • | any significant disruption in our operations or technology platform; |
| • | the amount of, and rate of growth in, the Company’s expenses (including salaries and associate benefits and marketing expenses) as the Company’s business develops or changes or as it expands into new market areas; |
| • | the ability of the Company to build the operational and organizational infrastructure necessary to engage in new businesses or to expand internationally; |
| • | the ability of the Company to recruit experienced personnel to assist in the management and operations of new products and services; and |
| • | other risk factors listed from time to time in the Company’s SEC reports, including, but not limited to, the Annual Report on Form 10-K for the year ended December 31, 2003. |
2
Item 7. Financial Statements, Pro Forma Financial Information and Exhibits.
| (c) | Exhibits. |
| Exhibit No. |
Description of Exhibit | |
| 99.1 | Press release, dated April 21, 2004. |
Item 9. Regulation FD Disclosure.
The Company hereby furnishes the information in Exhibit 99.2 hereto, First Quarter Earnings Presentation, for the quarter ended March 31, 2004.
Note: Information in Exhibit 99.2 furnished pursuant to Item 9 shall not be deemed to be “filed” for the purposes of Section 18 of the Securities Exchange Act of 1934 or otherwise subject to the liabilities of that section. This report will not be deemed an admission as to the materiality of any information in the report that is required to be disclosed solely by Regulation FD. Furthermore, the information provided in Exhibit 99.2 shall not be deemed to be incorporated by reference into the filings of the Company under the Securities Act of 1933.
Item 12. Results of Operations and Financial Condition
On April 21, 2004, the Company issued a press release announcing its financial results for the first quarter ended March 31, 2004. A copy of the Company’s press release is attached and filed herewith as Exhibit 99.1 to this Form 8-K and is incorporated herein by reference.
The Company’s consolidated financial statements prepared in accordance with generally accepted accounting principles (“GAAP”) are referred to as its “reported” financial statements. Loans included in securitization transactions which qualified as sales under GAAP have been removed from the Company’s “reported” balance sheet. However, interest income, interchange, fees and recoveries generated from the securitized loan portfolio net of charge-offs in excess of the interest paid to investors of asset-backed securitizations are recognized as non-interest income on the “reported” income statement.
The Company’s “managed” consolidated financial statements add back the effects of securitization transactions qualifying as sales under GAAP. The Company generates earnings from its “managed” loan portfolio which includes both on-balance sheet loans and off-balance sheet loans. The Company’s “managed” income statement takes the components of the non-interest income generated from the securitized portfolio and distributes the revenue to appropriate income statement line items from which it originated. For this reason the Company believes the “managed” consolidated financial statements and related managed metrics to be useful to stakeholders.
3
Earnings Conference Call Webcast Information.
Capital One will hold an earnings conference call on April 21, 2004, 5:00 PM Eastern time. The conference call will be accessible through live webcast. Interested investors and other interested individuals can access the webcast via Capital One’s home page (http://www.capitalone.com). Choose “Investors” to access the Investor Center and view and/or download the earnings press release, a reconciliation to GAAP financial measures and other relevant financial information. The replay of the webcast will be archived on Capital One’s website through May 5, 2004.
4
SIGNATURE
Pursuant to the requirements of the Securities Exchange Act of 1934, the Company has duly caused this Current Report on Form 8-K to be signed on its behalf by the undersigned, hereunto duly authorized.
| CAPITAL ONE FINANCIAL CORPORATION | ||||
| Dated: April 21, 2004 |
By: |
/s/ GARY L. PERLIN | ||
| Gary L. Perlin Executive Vice President and Chief Financial Officer | ||||
5
EXHIBIT INDEX
| 99.1 | Press Release of the Company dated April 21, 2004. |
| 99.2 | First Quarter Earnings Presentation. |
6
EXHIBIT 99.1
CAPITAL ONE FINANCIAL CORPORATION (COF)
FINANCIAL & STATISTICAL SUMMARY REPORTED BASIS
| (in millions, except per share data and as noted) | 2004 Q1 |
2003 Q4 |
2003 Q3 |
2003 Q2 |
2003 Q1 |
|||||||||||||||
| Earnings (Reported Basis) |
||||||||||||||||||||
| Net Interest Income |
$ | 732.0 | $ | 664.1 | $ | 703.9 | $ | 682.3 | $ | 734.8 | ||||||||||
| Non-Interest Income |
1,443.1 | 1,437.5 | 1,363.2 | 1,310.6 | 1,304.6 | |||||||||||||||
| Total Revenue(1) |
2,175.1 | 2,101.6 | 2,067.1 | 1,992.9 | 2,039.4 | |||||||||||||||
| Provision for Loan Losses |
243.7 | 390.4 | 364.1 | 387.1 | 375.9 | |||||||||||||||
| Marketing Expenses |
255.1 | 290.1 | 316.0 | 270.6 | 241.7 | |||||||||||||||
| Operating Expenses |
969.7 | 999.3 | 925.8 | 881.0 | 932.2 | |||||||||||||||
| Income Before Taxes and Accounting Change |
706.6 | 421.7 | 461.2 | 454.2 | 489.6 | |||||||||||||||
| Tax Rate |
36.2 | % | 37.0 | % | 37.0 | % | 37.0 | % | 37.0 | % | ||||||||||
| Cumulative Effect of Accounting Change, net of tax(2) |
— | — | 15.0 | — | — | |||||||||||||||
| Net Income |
$ | 450.8 | $ | 265.7 | $ | 275.5 | $ | 286.2 | $ | 308.5 | ||||||||||
| Common Share Statistics |
||||||||||||||||||||
| Basic EPS |
$ | 1.94 | $ | 1.16 | $ | 1.23 | $ | 1.28 | $ | 1.38 | ||||||||||
| Diluted EPS |
$ | 1.84 | $ | 1.11 | $ | 1.17 | $ | 1.23 | $ | 1.35 | ||||||||||
| Dividends Per Share |
$ | 0.03 | $ | 0.03 | $ | 0.03 | $ | 0.03 | $ | 0.03 | ||||||||||
| Book Value Per Share (period end) |
$ | 28.54 | $ | 25.75 | $ | 24.53 | $ | 23.37 | $ | 21.78 | ||||||||||
| Stock Price Per Share (period end) |
$ | 75.43 | $ | 61.29 | $ | 57.04 | $ | 49.18 | $ | 30.01 | ||||||||||
| Total Market Capitalization (period end) |
$ | 18,084.9 | $ | 14,405.7 | $ | 13,073.6 | $ | 11,170.0 | $ | 6,791.8 | ||||||||||
| Shares Outstanding (period end) |
239.8 | 235.0 | 229.2 | 227.1 | 226.3 | |||||||||||||||
| Shares Used to Compute Basic EPS |
232.0 | 228.1 | 224.6 | 223.7 | 223.0 | |||||||||||||||
| Shares Used to Compute Diluted EPS |
245.4 | 239.2 | 236.3 | 232.6 | 228.4 | |||||||||||||||
| Reported Balance Sheet Statistics (period avg.) |
||||||||||||||||||||
| Average Loans |
$ | 32,878 | $ | 31,297 | $ | 28,949 | $ | 27,101 | $ | 27,316 | ||||||||||
| Average Earning Assets |
$ | 44,112 | $ | 40,792 | $ | 38,133 | $ | 36,298 | $ | 34,144 | ||||||||||
| Average Assets |
$ | 47,699 | $ | 45,002 | $ | 41,704 | $ | 39,678 | $ | 38,318 | ||||||||||
| Average Equity |
$ | 6,443 | $ | 5,887 | $ | 5,424 | $ | 5,148 | $ | 4,823 | ||||||||||
| Return on Average Assets (ROA) |
3.78 | % | 2.36 | % | 2.64 | % | 2.89 | % | 3.22 | % | ||||||||||
| Return on Average Equity (ROE) |
27.99 | % | 18.05 | % | 20.32 | % | 22.24 | % | 25.59 | % | ||||||||||
| Reported Balance Sheet Statistics (period end) |
||||||||||||||||||||
| Loans |
$ | 33,172 | $ | 32,850 | $ | 30,618 | $ | 26,849 | $ | 27,634 | ||||||||||
| Total Assets |
$ | 49,146 | $ | 46,284 | $ | 43,446 | $ | 40,367 | $ | 37,911 | ||||||||||
| Capital (3) |
$ | 7,675 | $ | 6,882 | $ | 6,450 | $ | 6,130 | $ | 5,749 | ||||||||||
| Loan growth |
$ | 321 | $ | 2,232 | $ | 3,769 | $ | (785 | ) | $ | 290 | |||||||||
| % Loan Growth Q Over Q (annualized) |
4 | % | 29 | % | 56 | % | (11 | )% | 4 | % | ||||||||||
| % Loan Growth Y Over Y |
20 | % | 20 | % | 11 | % | 10 | % | 15 | % | ||||||||||
| Capital to Assets Ratio |
15.62 | % | 14.87 | % | 14.85 | % | 15.19 | % | 15.16 | % | ||||||||||
| Capital plus Allowance to Assets Ratio |
18.66 | % | 18.31 | % | 18.46 | % | 19.12 | % | 19.48 | % | ||||||||||
| Revenue & Expense Statistics (Reported) |
||||||||||||||||||||
| Net Interest Income Growth (annualized) |
41 | % | (23 | )% | 13 | % | (29 | )% | 2 | % | ||||||||||
| Non Interest Income Growth (annualized) |
2 | % | 22 | % | 16 | % | 2 | % | (5 | )% | ||||||||||
| Revenue Growth (annualized) |
14 | % | 7 | % | 15 | % | (9 | )% | (2 | )% | ||||||||||
| Net Interest Margin |
6.64 | % | 6.51 | % | 7.38 | % | 7.52 | % | 8.61 | % | ||||||||||
| Revenue Margin |
19.72 | % | 20.61 | % | 21.68 | % | 21.96 | % | 23.89 | % | ||||||||||
| Risk Adjusted Margin (4) |
16.62 | % | 17.02 | % | 17.66 | % | 17.16 | % | 18.49 | % | ||||||||||
| Loan Revenue Margin(5) |
26.44 | % | 26.78 | % | 28.51 | % | 29.46 | % | 29.73 | % | ||||||||||
| Loan Risk Adjusted Margin(6) |
22.27 | % | 22.10 | % | 23.22 | % | 23.03 | % | 22.97 | % | ||||||||||
| Operating Expense as a % of Revenues |
44.58 | % | 47.55 | % | 44.79 | % | 44.21 | % | 45.71 | % | ||||||||||
| Operating Expense as a % of Avg Loans (annualized) |
11.80 | % | 12.77 | % | 12.79 | % | 13.00 | % | 13.65 | % | ||||||||||
| Asset Quality Statistics (Reported) |
||||||||||||||||||||
| Allowance |
$ | 1,495 | $ | 1,595 | $ | 1,570 | $ | 1,590 | $ | 1,635 | ||||||||||
| 30+ Day Delinquencies |
$ | 1,266 | $ | 1,573 | $ | 1,540 | $ | 1,507 | $ | 1,490 | ||||||||||
| Net Charge-Offs |
$ | 342 | $ | 366 | $ | 383 | $ | 436 | $ | 462 | ||||||||||
| Allowance as a % of Reported Loans |
4.51 | % | 4.86 | % | 5.13 | % | 5.92 | % | 5.92 | % | ||||||||||
| Delinquency Rate (30+ days) |
3.82 | % | 4.79 | % | 5.03 | % | 5.61 | % | 5.39 | % | ||||||||||
| Net Charge-Off Rate |
4.17 | % | 4.68 | % | 5.30 | % | 6.43 | % | 6.76 | % | ||||||||||
(1) In accordance with the Company’s finance charge and fee revenue recognition policy, the amounts billed to customers but not recognized as revenue were as follows: Q1 2004 - $258.9 million, Q4 2003 - $454.8 million, Q3 2003 - $481.0 million, Q2 2003 - $497.3 million, and Q1 2003 - $519.7 million.
(2) Net charge from the adoption of FASB Interpretation No. 46, Consolidation of Variable Interest Entities.
(3) Includes preferred interests and mandatory convertible securities.
(4) Risk adjusted margin is total revenue less net charge-offs as a percentage of average earning assets.
(5) Loan revenue margin is total loan revenue, loan interest income less interest expense plus non-interest income, as a percent of average loans outstanding for the period. Loan interest expense is calculated using the cost of funds rate applied to the average consumer loan balance.
(6) Loan risk adjusted margin is total loan revenue, loan net interest income and non-interest income, less net charge-offs as a percentage of average loans outstanding for the period.
CAPITAL ONE FINANCIAL CORPORATION (COF)
FINANCIAL & STATISTICAL SUMMARY MANAGED BASIS(1)
| (in millions, except per share data and as noted) | 2004 Q1 |
2003 Q4 |
2003 Q3 |
2003 Q2 |
2003 Q1 |
|||||||||||||||
| Earnings (Managed Basis) |
||||||||||||||||||||
| Net Interest Income |
$ | 1,677.1 | $ | 1,571.7 | $ | 1,500.8 | $ | 1,457.5 | $ | 1,508.0 | ||||||||||
| Non-Interest Income |
1,014.5 | 1,077.5 | 1,049.2 | 1,046.0 | 1,027.9 | |||||||||||||||
| Total Revenue(2) |
2,691.6 | 2,649.2 | 2,550.0 | 2,503.5 | 2,535.9 | |||||||||||||||
| Provision for Loan Losses |
760.1 | 938.0 | 847.0 | 897.7 | 872.3 | |||||||||||||||
| Marketing Expenses |
255.1 | 290.1 | 316.0 | 270.6 | 241.7 | |||||||||||||||
| Operating Expenses |
969.7 | 999.3 | 925.8 | 881.0 | 932.2 | |||||||||||||||
| Income Before Taxes and Accounting Change |
706.6 | 421.7 | 461.2 | 454.2 | 489.6 | |||||||||||||||
| Tax Rate |
36.2 | % | 37.0 | % | 37.0 | % | 37.0 | % | 37.0 | % | ||||||||||
| Cumulative Effect of Accounting Change, net of tax(3) |
— | — | 15.0 | — | — | |||||||||||||||
| Net Income |
$ | 450.8 | $ | 265.7 | $ | 275.5 | $ | 286.2 | $ | 308.5 | ||||||||||
| Managed Balance Sheet Statistics (period avg.) |
||||||||||||||||||||
| Average Loans |
$ | 71,148 | $ | 68,679 | $ | 63,691 | $ | 59,916 | $ | 59,250 | ||||||||||
| Average Earning Assets |
$ | 80,495 | $ | 76,277 | $ | 71,022 | $ | 67,451 | $ | 64,602 | ||||||||||
| Average Assets |
$ | 85,324 | $ | 81,733 | $ | 75,831 | $ | 71,913 | $ | 69,670 | ||||||||||
| Return on Average Assets (ROA) |
2.11 | % | 1.30 | % | 1.45 | % | 1.59 | % | 1.77 | % | ||||||||||
| Managed Balance Sheet Statistics (period end) |
||||||||||||||||||||
| Loans |
$ | 71,817 | $ | 71,245 | $ | 67,260 | $ | 60,736 | $ | 59,214 | ||||||||||
| Total Assets |
$ | 87,197 | $ | 83,999 | $ | 79,465 | $ | 73,636 | $ | 68,927 | ||||||||||
| Loan Growth |
$ | 572 | $ | 3,985 | $ | 6,524 | $ | 1,522 | $ | (533 | ) | |||||||||
| % Loan Growth Q over Q (annualized) |
3 | % | 24 | % | 43 | % | 10 | % | (4 | )% | ||||||||||
| % Loan Growth Y over Y |
21 | % | 19 | % | 18 | % | 14 | % | 22 | % | ||||||||||
| Capital to Assets Ratio |
8.80 | % | 8.19 | % | 8.12 | % | 8.33 | % | 8.34 | % | ||||||||||
| Capital plus Allowance to Assets Ratio |
10.52 | % | 10.09 | % | 10.09 | % | 10.48 | % | 10.71 | % | ||||||||||
| Number of Accounts (000’s) |
46,712 | 47,038 | 46,406 | 45,785 | 46,423 | |||||||||||||||
| % Off-Balance Sheet Securitizations |
53 | % | 53 | % | 54 | % | 55 | % | 53 | % | ||||||||||
| % at Introductory Rate |
8 | % | 10 | % | 11 | % | 10 | % | 9 | % | ||||||||||
| Revenue & Expense Statistics (Managed) |
||||||||||||||||||||
| Net Interest Income Growth (annualized) |
27 | % | 19 | % | 12 | % | (13 | )% | 18 | % | ||||||||||
| Non Interest Income Growth (annualized) |
(23 | )% | 11 | % | 1 | % | 7 | % | (22 | )% | ||||||||||
| Revenue Growth (annualized) |
6 | % | 16 | % | 7 | % | (5 | )% | 1 | % | ||||||||||
| Net Interest Margin |
8.33 | % | 8.24 | % | 8.45 | % | 8.64 | % | 9.34 | % | ||||||||||
| Revenue Margin |
13.38 | % | 13.89 | % | 14.36 | % | 14.85 | % | 15.70 | % | ||||||||||
| Risk Adjusted Margin (4) |
9.11 | % | 9.10 | % | 9.48 | % | 9.23 | % | 9.77 | % | ||||||||||
| Loan Revenue Margin (5) |
15.26 | % | 15.54 | % | 16.15 | % | 16.87 | % | 17.20 | % | ||||||||||
| Loan Risk Adjusted Margin (6) |
10.43 | % | 10.22 | % | 10.71 | % | 10.56 | % | 10.73 | % | ||||||||||
| Operating Expense as a % of Revenues |
36.03 | % | 37.72 | % | 36.31 | % | 35.19 | % | 36.76 | % | ||||||||||
| Operating Expense as a % of Avg Loans (annualized) |
5.45 | % | 5.82 | % | 5.81 | % | 5.88 | % | 6.29 | % | ||||||||||
| Asset Quality Statistics (Managed) |
||||||||||||||||||||
| 30+ Day Delinquencies |
$ | 2,731 | $ | 3,178 | $ | 3,126 | $ | 3,004 | $ | 2,942 | ||||||||||
| Net Charge-Offs |
$ | 859 | $ | 914 | $ | 866 | $ | 946 | $ | 958 | ||||||||||
| Delinquency Rate (30+ days) |
3.80 | % | 4.46 | % | 4.65 | % | 4.95 | % | 4.97 | % | ||||||||||
| Net Charge-Off Rate |
4.83 | % | 5.32 | % | 5.44 | % | 6.32 | % | 6.47 | % | ||||||||||
(1) The information in this statistical summary reflects the adjustment to add back the effect of securitization transactions qualifying as sales under generally accepted accounting principles. See accompanying schedule—“Reconciliation to GAAP Financial Measures”.
(2) In accordance with the Company’s finance charge and fee revenue recognition policy, the amounts billed to customers but not recognized as revenue were as follows: Q1 2004 - $258.9 million, Q4 2003 - $454.8 million, Q3 2003 - $481.0 million, Q2 2003 - $497.3 million, and Q1 2003 - $519.7 million.
(3) Net charge from the adoption of FASB Interpretation No. 46, Consolidation of Variable Interest Entities.
(4) Risk adjusted margin is total revenue less net charge-offs as a percentage of average earning assets.
(5) Loan revenue margin is total loan revenue, loan interest income less interest expense plus non-interest income, as a percent of average loans outstanding for the period. Loan interest expense is calculated using the cost of funds rate applied to the average consumer loan balance.
(6) Loan risk adjusted margin is total loan revenue, loan net interest income and non-interest income, less net charge-offs as a percentage of average loans outstanding for the period.
CAPITAL ONE FINANCIAL CORPORATION (COF)
SEGMENT FINANCIAL & STATISTICAL SUMMARY—MANAGED BASIS(1)
| (in millions, except per share data and as noted) | 2004 Q1 |
2003 Q4 |
2003 Q3 |
2003 Q2 |
2003 Q1 |
|||||||||||||||
| Segment Statistics |
||||||||||||||||||||
| US Card: |
||||||||||||||||||||
| Loans receivable |
$ | 45,298 | $ | 46,279 | $ | 44,300 | $ | 39,318 | $ | 38,737 | ||||||||||
| Net income (loss) |
$ | 386.8 | $ | 322.7 | $ | 276.2 | $ | 274.2 | $ | 308.1 | ||||||||||
| Net charge-off rate |
5.41 | % | 6.16 | % | 6.16 | % | 7.63 | % | 7.72 | % | ||||||||||
| Delinquency rate (30+ days) |
3.99 | % | 4.60 | % | 4.88 | % | 5.42 | % | 5.55 | % | ||||||||||
| Auto Finance: |
||||||||||||||||||||
| Loans receivable |
$ | 8,834 | $ | 8,467 | $ | 8,008 | $ | 7,380 | $ | 7,742 | ||||||||||
| Net income (loss) |
$ | 30.7 | $ | 34.4 | $ | 27.3 | $ | 44.0 | $ | (6.5 | ) | |||||||||
| Net charge-off rate |
4.13 | % | 4.30 | % | 5.10 | % | 4.22 | % | 4.91 | % | ||||||||||
| Delinquency rate (30+ days) |
5.44 | % | 7.55 | % | 7.07 | % | 6.97 | % | 5.37 | % | ||||||||||
| Global Financial Services: |
||||||||||||||||||||
| Loans receivable |
$ | 17,643 | $ | 16,508 | $ | 14,960 | $ | 14,046 | $ | 12,726 | ||||||||||
| Net income (loss) |
$ | 50.9 | $ | 3.3 | $ | 21.0 | $ | 25.5 | $ | 14.9 | ||||||||||
| Net charge-off rate |
3.60 | % | 3.69 | % | 3.78 | % | 3.95 | % | 3.95 | % | ||||||||||
| Delinquency rate (30+ days) |
2.63 | % | 2.70 | % | 2.87 | % | 2.81 | % | 2.98 | % | ||||||||||
(1) The information in this statistical summary reflects the adjustment to add back the effect of securitization transactions qualifying as sales under generally accepted accounting principles. See accompanying schedule—“Reconciliation to GAAP Financial Measures”.
CAPITAL ONE FINANCIAL CORPORATION
Reconciliation to GAAP Financial Measures
For the Three Months Ended March 31, 2004
(dollars in thousands)(unaudited)
The Company’s consolidated financial statements prepared in accordance with generally accepted accounting principles (“GAAP”) are referred to as its “reported” financial statements. Loans included in securitization transactions which qualified as sales under GAAP have been removed from the Company’s “reported” balance sheet. However, interest income, interchange, fees and recoveries generated from the securitized loan portfolio net of charge-offs in excess of the interest paid to investors of asset-backed securitizations are recognized as non-interest income on the “reported” income statement.
The Company’s “managed” consolidated financial statements add back the effects of securitization transactions qualifying as sales under GAAP. The Company generates earnings from its “managed” loan portfolio which includes both the on-balance sheet loans and off-balance sheet loans. The Company’s “managed” income statement takes the components of the non-interest income generated from the securitized portfolio and distributes the revenue to appropriate income statement line items from which it originated. For this reason the Company believes the “managed” consolidated financial statements and related managed metrics to be useful to stakeholders.
| Total Reported | Adjustments(1) | Total Managed(2) | ||||||||
| Income Statement Measures |
||||||||||
| Net interest income |
$ | 732,022 | $ | 945,056 | $ | 1,677,078 | ||||
| Non-interest income |
$ | 1,443,134 | $ | (428,598 | ) | $ | 1,014,536 | |||
| Total revenue |
$ | 2,175,156 | $ | 516,458 | $ | 2,691,614 | ||||
| Provision for loan losses |
$ | 243,668 | $ | 516,458 | $ | 760,126 | ||||
| Net charge-offs |
$ | 342,391 | $ | 516,458 | $ | 858,849 | ||||
| Balance Sheet Measures |
||||||||||
| Consumer loans |
$ | 33,171,516 | $ | 38,645,386 | $ | 71,816,902 | ||||
| Total assets |
$ | 49,146,425 | $ | 38,050,487 | $ | 87,196,912 | ||||
| Average consumer loans |
$ | 32,877,525 | $ | 38,270,762 | $ | 71,148,287 | ||||
| Average earning assets |
$ | 44,111,541 | $ | 36,383,693 | $ | 80,495,234 | ||||
| Average total assets |
$ | 47,699,012 | $ | 37,625,031 | $ | 85,324,043 | ||||
| Delinquencies |
$ | 1,266,425 | $ | 1,464,913 | $ | 2,731,338 | ||||
(1) Includes adjustments made related to the effects of securitization transactions qualifying as sales under GAAP and adjustments made to reclassify to “managed” loans outstanding the collectible portion of billed finance charge and fee income on the investors’ interest in securitized loans excluded from loans outstanding on the “reported” balance sheet in accordance with Financial Accounting Standards Board Staff Position, “Accounting for Accrued Interest Receivable Related to Securitized and Sold Receivables under FASB Statement 140, Accounting for Transfers and Servicing of Financial Assets and Extinguishments of Liabilities”, issued April 2003.
(2) The Managed loan portfolio does not include auto loans which have been sold in whole loan sale transactions where the Company has retained servicing rights.
CAPITAL ONE FINANCIAL CORPORATION
Consolidated Balance Sheets
(in thousands)(unaudited)
| March 31 2004 |
December 31 2003 |
March 31 2003 |
||||||||||
| Assets: |
||||||||||||
| Cash and due from banks |
$ | 323,346 | $ | 382,212 | $ | 328,791 | ||||||
| Federal funds sold and resale agreements |
1,257,666 | 1,010,319 | 864,036 | |||||||||
| Interest-bearing deposits at other banks |
188,237 | 587,751 | 247,560 | |||||||||
| Cash and cash equivalents |
1,769,249 | 1,980,282 | 1,440,387 | |||||||||
| Securities available for sale |
9,149,440 | 5,866,628 | 4,817,322 | |||||||||
| Consumer loans |
33,171,516 | 32,850,269 | 27,634,440 | |||||||||
| Less: Allowance for loan losses |
(1,495,000 | ) | (1,595,000 | ) | (1,635,000 | ) | ||||||
| Net loans |
31,676,516 | 31,255,269 | 25,999,440 | |||||||||
| Accounts receivable from securitizations |
4,008,809 | 4,748,962 | 3,378,593 | |||||||||
| Premises and equipment, net |
898,802 | 902,600 | 769,112 | |||||||||
| Interest receivable |
236,852 | 214,295 | 208,998 | |||||||||
| Other |
1,406,757 | 1,315,670 | 1,297,115 | |||||||||
| Total assets |
$ | 49,146,425 | $ | 46,283,706 | $ | 37,910,967 | ||||||
| Liabilities: |
||||||||||||
| Interest-bearing deposits |
$ | 23,610,851 | $ | 22,416,332 | $ | 18,489,388 | ||||||
| Senior and subordinated notes |
7,224,798 | 7,016,020 | 5,116,591 | |||||||||
| Other borrowings |
8,254,383 | 7,796,613 | 6,576,876 | |||||||||
| Interest payable |
245,172 | 256,015 | 194,629 | |||||||||
| Other |
2,968,993 | 2,746,915 | 2,604,818 | |||||||||
| Total liabilities |
42,304,197 | 40,231,895 | 32,982,302 | |||||||||
| Stockholders’ Equity: |
||||||||||||
| Common stock |
2,411 | 2,364 | 2,275 | |||||||||
| Paid-in capital, net |
2,218,861 | 1,937,302 | 1,730,883 | |||||||||
| Retained earnings and cumulative other comprehensive income |
4,670,384 | 4,161,666 | 3,244,673 | |||||||||
| Less: Treasury stock, at cost |
(49,428 | ) | (49,521 | ) | (49,166 | ) | ||||||
| Total stockholders’ equity |
6,842,228 | 6,051,811 | 4,928,665 | |||||||||
| Total liabilities and stockholders’ equity |
$ | 49,146,425 | $ | 46,283,706 | $ | 37,910,967 | ||||||
CAPITAL ONE FINANCIAL CORPORATION
Consolidated Statements of Income
(in thousands, except per share data)(unaudited)
| Three Months Ended | |||||||||
| March 31 2004 |
December 31 2003 |
March 31 2003 | |||||||
| Interest Income: |
|||||||||
| Consumer loans, including past-due fees |
$ | 1,035,017 | $ | 969,571 | $ | 1,013,282 | |||
| Securities available for sale |
63,716 | 52,328 | 42,931 | ||||||
| Other |
65,998 | 65,884 | 50,353 | ||||||
| Total interest income |
1,164,731 | 1,087,783 | 1,106,566 | ||||||
| Interest Expense: |
|||||||||
| Deposits |
239,512 | 237,624 | 209,308 | ||||||
| Senior and subordinated notes |
130,515 | 123,409 | 104,097 | ||||||
| Other borrowings |
62,682 | 62,649 | 58,357 | ||||||
| Total interest expense |
432,709 | 423,682 | 371,762 | ||||||
| Net interest income |
732,022 | 664,101 | 734,804 | ||||||
| Provision for loan losses |
243,668 | 390,405 | 375,851 | ||||||
| Net interest income after provision for loan losses |
488,354 | 273,696 | 358,953 | ||||||
| Non-Interest Income: |
|||||||||
| Servicing and securitizations |
917,669 | 918,762 | 729,689 | ||||||
| Service charges and other customer-related fees |
354,493 | 380,925 | 441,226 | ||||||
| Interchange |
105,595 | 106,414 | 85,351 | ||||||
| Other |
65,377 | 31,390 | 48,337 | ||||||
| Total non-interest income |
1,443,134 | 1,437,491 | 1,304,603 | ||||||
| Non-Interest Expense: |
|||||||||
| Salaries and associate benefits |
424,392 | 408,884 | 398,467 | ||||||
| Marketing |
255,147 | 290,145 | 241,696 | ||||||
| Communications and data processing |
117,106 | 116,217 | 112,052 | ||||||
| Supplies and equipment |
88,321 | 83,804 | 83,812 | ||||||
| Occupancy |
38,719 | 51,645 | 43,574 | ||||||
| Other |
301,211 | 338,777 | 294,331 | ||||||
| Total non-interest expense |
1,224,896 | 1,289,472 | 1,173,932 | ||||||
| Income before income taxes |
706,592 | 421,715 | 489,624 | ||||||
| Income taxes |
255,786 | 156,034 | 181,161 | ||||||
| Net income |
$ | 450,806 | $ | 265,681 | $ | 308,463 | |||
| Basic earnings per share |
$ | 1.94 | $ | 1.16 | $ | 1.38 | |||
| Diluted earnings per share |
$ | 1.84 | $ | 1.11 | $ | 1.35 | |||
| Dividends paid per share |
$ | 0.03 | $ | 0.03 | $ | 0.03 | |||
CAPITAL ONE FINANCIAL CORPORATION
Statements of Average Balances, Income and Expense, Yields and Rates
(dollars in thousands)(unaudited)
| Reported | Quarter Ended 3/31/04 |
Quarter Ended 12/31/03 |
Quarter Ended 3/31/03 |
||||||||||||||||||||||||
| Average Balance |
Income/ Expense |
Yield/ Rate |
Average Balance |
Income/ Expense |
Yield/ Rate |
Average Balance |
Income/ Expense |
Yield/ Rate |
|||||||||||||||||||
| Earnings assets: |
|||||||||||||||||||||||||||
| Consumer loans |
$ | 32,877,525 | $ | 1,035,017 | 12.59 | % | $ | 31,297,123 | $ | 969,571 | 12.39 | % | $ | 27,316,194 | $ | 1,013,282 | 14.84 | % | |||||||||
| Securities available for sale |
7,098,951 | 63,716 | 3.59 | 5,816,001 | 52,328 | 3.60 | 4,417,538 | 42,931 | 3.89 | ||||||||||||||||||
| Other |
4,135,065 | 65,998 | 6.38 | 3,679,088 | 65,884 | 7.16 | 2,410,750 | 50,353 | 8.35 | ||||||||||||||||||
| Total earnings assets |
$ | 44,111,541 | $ | 1,164,731 | 10.56 | % | $ | 40,792,212 | $ | 1,087,783 | 10.67 | % | $ | 34,144,482 | $ | 1,106,566 | 12.96 | % | |||||||||
| Interest-bearing liabilities: |
|||||||||||||||||||||||||||
| Deposits |
$ | 22,992,712 | $ | 239,512 | 4.17 | % | $ | 21,604,968 | $ | 237,624 | 4.40 | % | $ | 17,940,058 | $ | 209,308 | 4.67 | % | |||||||||
| Senior and subordinated notes |
7,270,889 | 130,515 | 7.18 | 6,734,569 | 123,409 | 7.33 | 5,309,690 | 104,097 | 7.84 | ||||||||||||||||||
| Other borrowings |
7,834,046 | 62,682 | 3.20 | 7,661,016 | 62,649 | 3.27 | 7,009,915 | 58,357 | 3.33 | ||||||||||||||||||
| Total interest-bearing liabilities |
$ | 38,097,647 | $ | 432,709 | 4.54 | % | $ | 36,000,553 | $ | 423,682 | 4.71 | % | $ | 30,259,663 | $ | 371,762 | 4.91 | % | |||||||||
| Net interest spread |
6.02 | % | 5.96 | % | 8.05 | % | |||||||||||||||||||||
| Interest income to average earning assets |
10.56 | % | 10.67 | % | 12.96 | % | |||||||||||||||||||||
| Interest expense to average earning assets |
3.92 | 4.16 | 4.35 | ||||||||||||||||||||||||
| Net interest margin |
6.64 | % | 6.51 | % | 8.61 | % | |||||||||||||||||||||
CAPITAL ONE FINANCIAL CORPORATION
Statements of Average Balances, Income and Expense, Yields and Rates
(dollars in thousands)(unaudited)
| Managed (1) | Quarter Ended 3/31/04 |
Quarter Ended 12/31/03 |
Quarter Ended 3/31/03 |
||||||||||||||||||||||||
| Average Balance |
Income/ Expense |
Yield/ Rate |
Average Balance |
Income/ Expense |
Yield/ Rate |
Average Balance |
Income/ Expense |
Yield/ Rate |
|||||||||||||||||||
| Earning assets: |
|||||||||||||||||||||||||||
| Consumer loans |
$ | 71,148,287 | $ | 2,405,738 | 13.53 | % | $ | 68,678,877 | $ | 2,295,802 | 13.37 | % | $ | 59,249,698 | $ | 2,148,419 | 14.50 | % | |||||||||
| Securities available for sale |
7,098,951 | 63,716 | 3.59 | 5,816,001 | 52,328 | 3.60 | 4,417,538 | 42,931 | 3.89 | ||||||||||||||||||
| Other |
2,247,996 | 13,056 | 2.32 | 1,782,263 | 11,326 | 2.54 | 934,382 | 5,323 | 2.28 | ||||||||||||||||||
| Total earning assets |
$ | 80,495,234 | $ | 2,482,510 | 12.34 | % | $ | 76,277,141 | $ | 2,359,456 | 12.37 | % | $ | 64,601,618 | $ | 2,196,673 | 13.60 | % | |||||||||
| Interest-bearing liabilities: |
|||||||||||||||||||||||||||
| Deposits |
$ | 22,992,712 | $ | 239,512 | 4.17 | % | $ | 21,604,968 | $ | 237,624 | 4.40 | % | $ | 17,940,058 | $ | 209,308 | 4.67 | % | |||||||||
| Senior and subordinated notes |
7,270,889 | 130,515 | 7.18 | 6,734,569 | 123,409 | 7.33 | 5,309,690 | 104,097 | 7.84 | ||||||||||||||||||
| Other borrowings |
7,834,046 | 62,682 | 3.20 | 7,661,016 | 62,649 | 3.27 | 7,009,915 | 58,357 | 3.33 | ||||||||||||||||||
| Securitization liability |
37,669,211 | 372,723 | 3.96 | 36,766,829 | 364,092 | 3.96 | 31,361,051 | 316,960 | 4.04 | ||||||||||||||||||
| Total interest-bearing liabilities |
$ | 75,766,858 | $ | 805,432 | 4.25 | % | $ | 72,767,382 | $ | 787,774 | 4.33 | % | $ | 61,620,714 | $ | 688,722 | 4.47 | % | |||||||||
| Net interest spread |
8.09 | % | 8.04 | % | 9.13 | % | |||||||||||||||||||||
| Interest income to average earning assets |
12.34 | % | 12.37 | % | 13.60 | % | |||||||||||||||||||||
| Interest expense to average earning assets |
4.01 | 4.13 | 4.26 | ||||||||||||||||||||||||
| Net interest margin |
8.33 | % | 8.24 | % | 9.34 | % | |||||||||||||||||||||
| (1) | The information in this table reflects the adjustment to add back the effect of securitized loans. |
NEWS RELEASE

1680 Capital One Drive McLean, VA 22102-3491
FOR IMMEDIATE RELEASE: April 21, 2004
| Contacts: | Paul Paquin | Tatiana Stead | ||||||||
| V.P., Investor Relations | Director, Corporate Media | |||||||||
| (703) 720-2456 | (703) 720-2352 |
Capital One Reports First Quarter Earnings
36 % EPS Increase Over Year Ago Period
2004 Earnings Guidance Unchanged
McLean, VA.(April 21,2004)—Capital One Financial Corporation (NYSE: COF) today announced that its fully diluted earnings per share for the first quarter of 2004 increased by 36 percent over the first quarter of 2003. The company has left unchanged its 2004 earnings guidance of $5.30 to $5.60 per share (fully diluted).
Earnings for the first quarter of 2004 were $450.8 million, or $1.84 per share (fully diluted), compared with earnings of $308.5 million, or $1.35 per share, for the first quarter of 2003 and $265.7 million, or $1.11 per share, in the previous quarter.
“We are pleased to report record earnings in the first quarter, which reflects strong credit performance and increased profitability of our diversified businesses,” said Richard D. Fairbank, Capital One’s Chairman and Chief Executive Officer. “We expect that the pattern of earnings reported this year will be similar to that of last year, starting with the highest earnings in the first quarter and moderating earnings as the year progresses.”
During the first quarter of 2004, Capital One grew its managed loan portfolio by $572.1 million to $71.8 billion. The managed charge-off rate declined to 4.83 percent in the first quarter of 2004, from 5.32 percent in the previous quarter and 6.47 percent in the first quarter of 2003. The managed delinquency rate (30+ days) declined to 3.80 percent as of March 31, 2004 from 4.46 percent as of the end of the previous quarter and 4.97 percent as of March 31, 2003.
The company continues to diversify its portfolio and earnings beyond U.S. credit cards and shift its product mix upmarket. As a result, Capital One’s managed revenue margin declined to 13.38 percent in the first quarter of 2004 from 13.89 percent in the previous quarter and 15.70 percent in the first quarter of 2003. As the company continues its asset diversification and its shift upmarket, management expects revenue margins to continue to trend somewhat lower in 2004.
-more-
Capital One Reports First Quarter Earnings
At the same time, declining credit losses and other expenses are expected to leave the company’s return on managed assets relatively stable for the full year of 2004 as compared with 2003. The company expects its charge-off rate for the remaining three quarters of 2004 to be between four and five percent.
“The decline in the managed delinquency rate (30+ days) to 3.80 percent at the end of the first quarter from 4.46 percent the end of the previous quarter is a key driver of our reduced provisioning expense,” said Gary L. Perlin, Capital One’s Chief Financial Officer. “This decline, along with our expectation of little to no growth in the subprime portion of the company’s credit card portfolio, leads us to expect that our allowance for loan losses will continue to move somewhat lower in the near term.”
The company generates earnings from its managed loan portfolio, which includes both on-balance sheet loans and securitized loans. For this reason, the company believes managed financial measures to be useful to stakeholders. In compliance with Regulation G of the Securities and Exchange Commission, the company is providing a numerical reconciliation of managed financial measures to comparable measures calculated on a reported basis using generally accepted accounting principles (GAAP). Please see the schedule titled “Reconciliation to GAAP Financial Measures” attached to this release for more information.
The company cautions that its current expectations in this release, in the presentation slides available on the company’s website (www.capitalone.com), and on its Form 10-K for the fiscal year ended December 31, 2003, for 2004 earnings, charge-off rates, revenue margins, allowance for loan losses, loan growth, and the composition of loan growth are forward-looking statements and actual results could differ materially from current expectations due to a number of factors, including: continued intense competition from numerous providers of products and services which compete with our businesses; changes in our aggregate accounts and balances, and the growth rate and composition thereof; the company’s ability to continue to diversify its assets; the company’s ability to access the capital markets at attractive rates and terms to fund its operations and future growth; and general economic conditions affecting consumer income and spending, which may affect consumer bankruptcies, defaults, and charge-offs.
A discussion of these and other factors can be found in Capital One’s annual report and other reports filed with the Securities and Exchange Commission, including, but not limited to, Capital One’s report on Form 10-K for the fiscal year ended December 31, 2003.
-more-
Capital One Reports First Quarter Earnings
About Capital One
Headquartered in McLean, Virginia, Capital One Financial Corporation (www.capitalone.com) is a holding company whose principal subsidiaries, Capital One Bank and Capital One, F.S.B., offer consumer lending products and Capital One Auto Finance, Inc., offers automobile and other motor vehicle financing products. Capital One’s subsidiaries collectively had 46.7 million managed accounts and $71.8 billion in managed loans outstanding as of March 31, 2004. Capital One, a Fortune 500 company, is one of the largest providers of MasterCard and Visa credit cards in the world. Capital One trades on the New York Stock Exchange under the symbol “COF” and is included in the S&P 500 index.
###
NOTE: First quarter 2004 financial results, SEC Filings, and first quarter earnings conference call slides are accessible on Capital One’s home page (www.capitalone.com). Choose “Investors” under “Company Information” on the left side of the page to view and download the earnings press release, slides, and other financial information. Additionally, a webcast of today’s 5:00pm (EDT) earnings conference call is accessible through the same link.
First Quarter 2004 Results
April 21, 2004
First Quarter 2004 Results
1
Forward looking statements
Please note that the following materials containing information regarding Capital One’s financial performance speak only as of the particular date or dates indicated in these materials. Capital One does not undertake any obligation to update or revise any of the information contained herein whether as a result of new information, future events or otherwise.
Certain statements in this presentation and other oral and written statements made by the Company from time to time, are forward-looking statements, including those that discuss strategies, goals, outlook or other non-historical matters; or project revenues, income, returns, earnings per share or other financial measures. To the extent any such information is forward-looking, it is intended to fit within the safe harbor for forward-looking information provided by the Private Securities Litigation Reform Act of 1995. Numerous factors could cause our actual results to differ materially from those described in forward-looking statements, including, among other things: continued intense competition from numerous providers of products and services which compete with our businesses; an increase in credit losses; financial, legal, regulatory or accounting changes or actions; changes in interest rates, general economic conditions affecting consumer income, spending and repayments; changes in our aggregate accounts or consumer loan balances and the growth rate and composition thereof; changes in the reputation of the credit card industry and/or the company with respect to practices and products; our ability to continue to securitize our credit cards and consumer loans and to otherwise access the capital markets at attractive rates and terms to fund our operations and future growth; our ability to successfully continue to diversify our assets, losses associated with new products or services or expansion internationally; any significant disruption of, or loss of public confidence in, the United States Mail service affecting our response rates and consumer payments; any significant disruption in our operations or technology platform, our ability to recruit experienced personnel to assist in the management and operations of new products and services; and other factors listed from time to time in reports we file with the Securities and Exchange Commission (the “SEC”) , including, but not limited to, factors set forth under the caption “Risk Factors” in our Annual Report on Form 10-K for the year ended December 31, 2003, and any subsequent quarterly reports on Form 10-Q. You should carefully consider the factors discussed above in evaluating these forward-looking statements.
All information in these slides is based on the consolidated results of Capital One Financial Corporation. Further information about Capital One can be obtained from the Corporation’s public filings with the SEC. A reconciliation of any non-GAAP financial measures included in this presentation can be found in the Company’s most recent Form 8-K or Form 10-Q concerning quarterly financial results, available on the Company’s website at www.capitalone.com in Investor Relations under “About Capital One.”
First Quarter 2004 Results 2
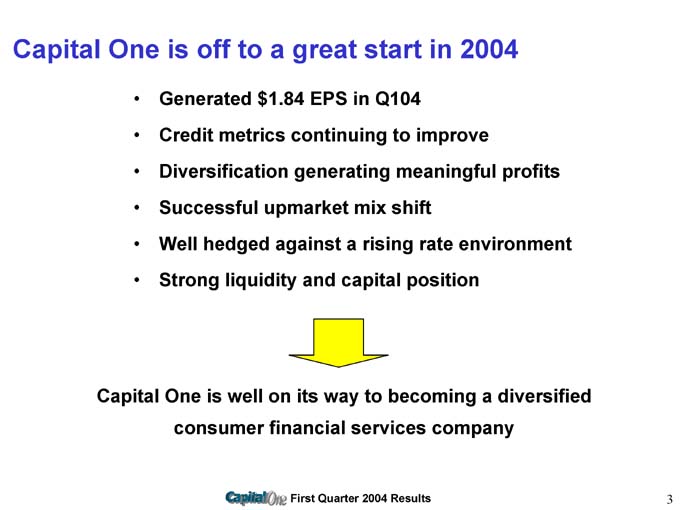
Capital One is off to a great start in 2004
• Generated $1.84 EPS in Q104
• Credit metrics continuing to improve
• Diversification generating meaningful profits
• Successful upmarket mix shift
• Well hedged against a rising rate environment
• Strong liquidity and capital position
Capital One is well on its way to becoming a diversified consumer financial services company
First Quarter 2004 Results 3
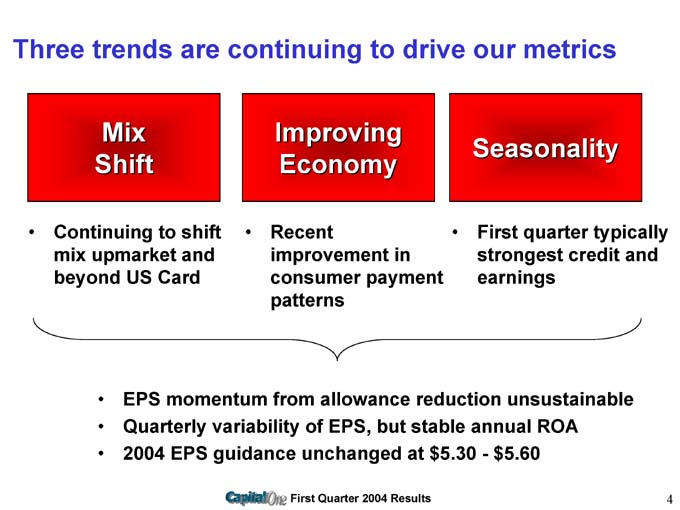
Three trends are continuing to drive our metrics
Mix Shift
• Continuing to shift mix upmarket and beyond US Card
Improving Economy
• Recent improvement in consumer payment patterns
Seasonality
• First quarter typically strongest credit and earnings
• EPS momentum from allowance reduction unsustainable
• Quarterly variability of EPS, but stable annual ROA
• 2004 EPS guidance unchanged at $5.30—$5.60
First Quarter 2004 Results 4
First quarter 2004
Financial Update
Business Update
First Quarter 2004 Results 5
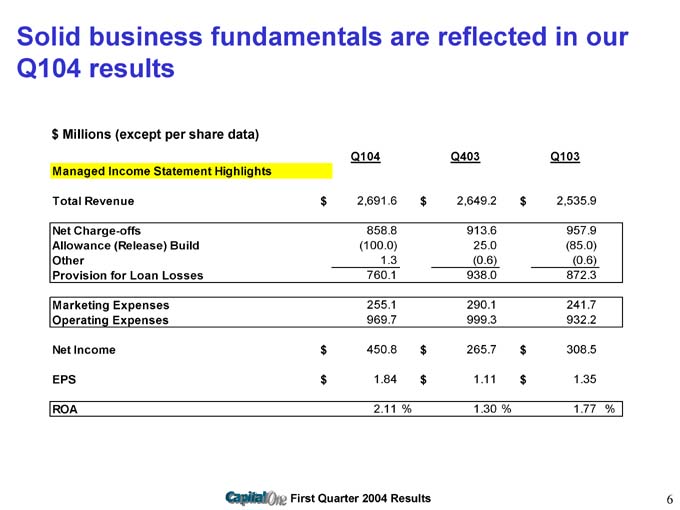
Solid business fundamentals are reflected in our Q104 results
$ Millions (except per share data)
Q104 Q403 Q103
Managed Income Statement Highlights
Total Revenue $ 2,691.6 $ 2,649.2 $ 2,535.9
Net Charge-offs 858.8 913.6 957.9
Allowance (Release) Build (100.0) 25.0 (85.0)
Other 1.3 (0.6) (0.6)
Provision for Loan Losses 760.1 938.0 872.3
Marketing Expenses 255.1 290.1 241.7
Operating Expenses 969.7 999.3 932.2
Net Income $ 450.8 $ 265.7 $ 308.5
EPS $ 1.84 $ 1.11 $ 1.35
ROA 2.11 % 1.30 % 1.77 %
First Quarter 2004 Results 6
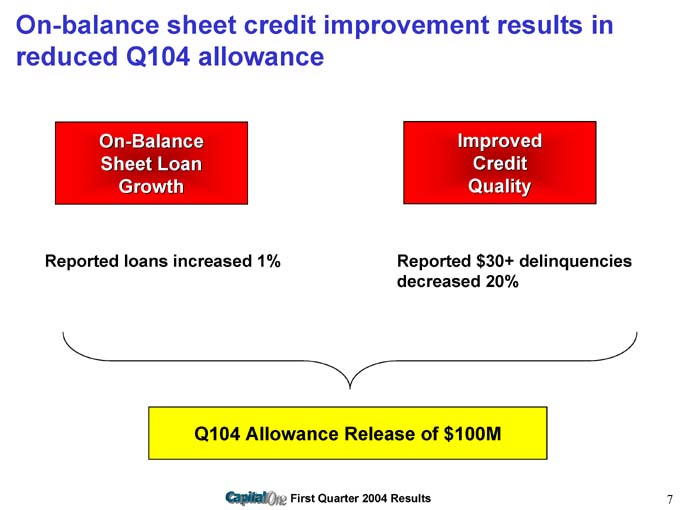
On-balance sheet credit improvement results in reduced Q104 allowance
On-Balance Sheet Loan Growth
Reported loans increased 1%
Improved Credit Quality
Reported $30+ delinquencies decreased 20%
Q104 Allowance Release of $100M
First Quarter 2004 Results
7
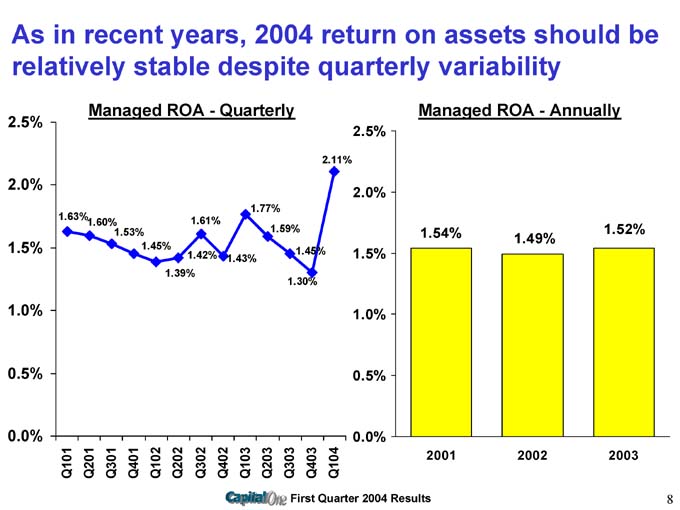
As in recent years, 2004 return on assets should be relatively stable despite quarterly variability
Managed ROA – Quarterly
1.63% 1.60% 1.53% 1.45% 1.39% 1.61% 1.42% 1.43% 1.77% 1.59% 1.45% 1.30% 2.11%
Managed ROA—Annually
2001 1.54%
2002 1.49%
2003 1.52%
First Quarter 2004 Results 8
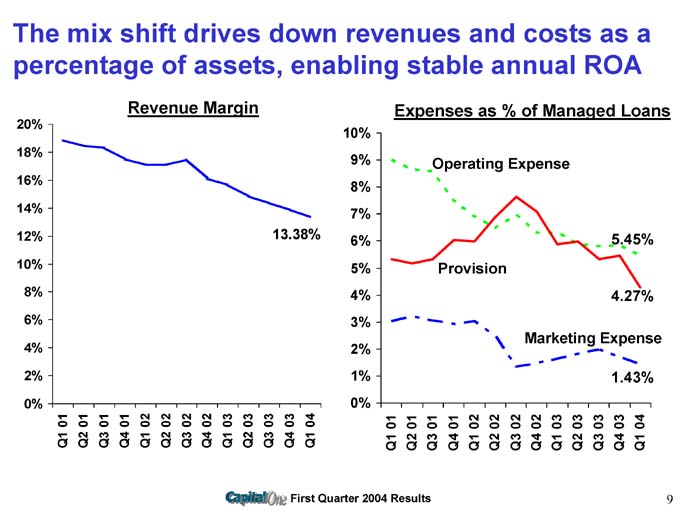
The mix shift drives down revenues and costs as a percentage of assets, enabling stable annual ROA
Revenue Margin
13.38%
Expenses as % of Managed Loans
Operating Expense 5.45%
Provision 4.27%
Marketing Expense 1.43%
First Quarter 2004 Results 9
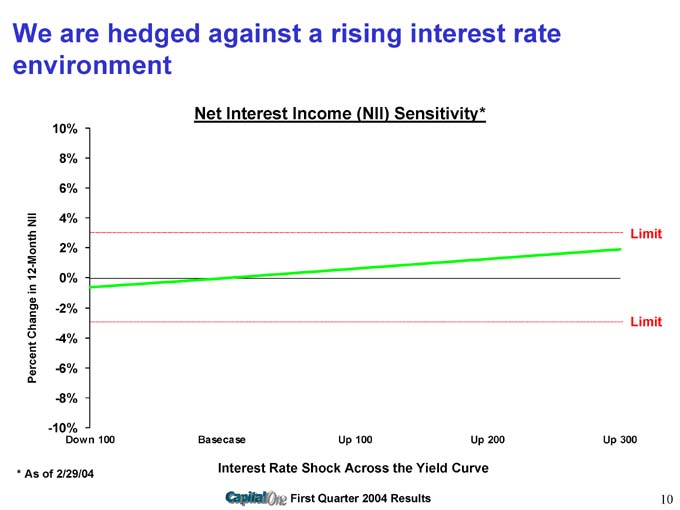
We are hedged against a rising interest rate environment
Net Interest Income (NII) Sensitivity*
* As of 2/29/04
Interest Rate Shock Across the Yield Curve
First Quarter 2004 Results 10
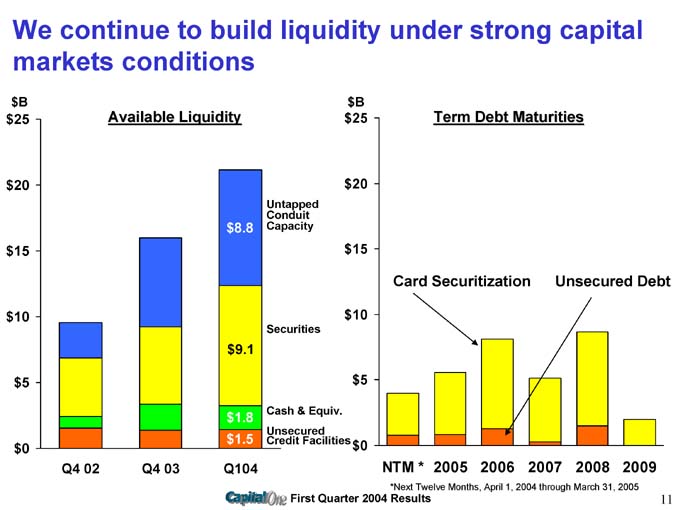
We continue to build liquidity under strong capital markets conditions
Available Liquidity
$8.8 Untapped Conduit Capacity
$9.1 Securities Cash & Equiv.
$1.8 Unsecured
$1.5 Credit Facilities
Term Debt Maturities
Card Securitization
Unsecured Debt
*Next Twelve Months, April 1, 2004 through March 31, 2005
First Quarter 2004 Results 11
First Quarter 2004
Financial Update
Business Update
First Quarter 2004 Results 12
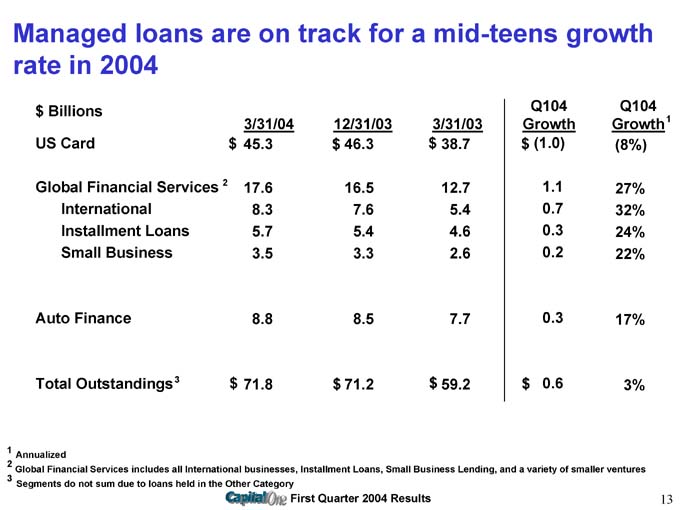
Managed loans are on track for a mid-teens growth rate in 2004
$ Billions Q104 Q104
3/31/04 12/31/03 3/31/03 Growth Growth1
US Card $ 45.3 $ 46.3 $ 38.7 $ (1.0) (8%)
Global Financial Services 2 17.6 16.5 12.7 1.1 27%
International 8.3 7.6 5.4 0.7 32%
Installment Loans 5.7 5.4 4.6 0.3 24%
Small Business 3.5 3.3 2.6 0.2 22%
Auto Finance 8.8 8.5 7.7 0.3 17%
Total Outstandings3 $ 71.8 $ 71.2 $ 59.2 $ 0.6 3%
1 Annualized
2 Global Financial Services includes all International businesses, Installment Loans, Small Business Lending, and a variety of smaller ventures
3 Segments do not sum due to loans held in the Other Category
First Quarter 2004 Results 13
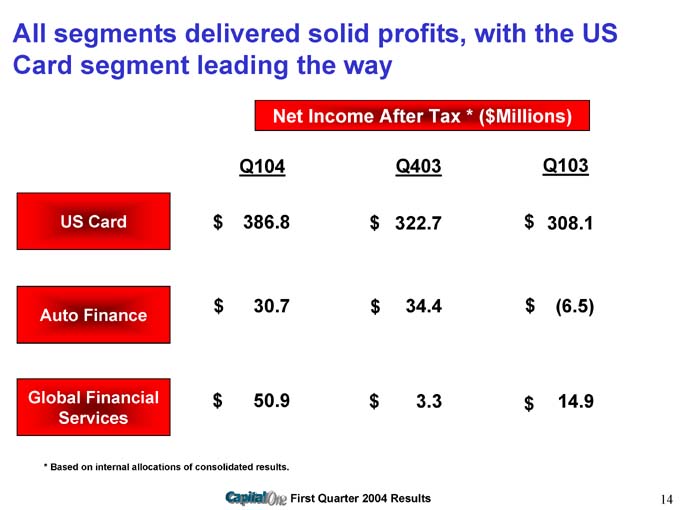
All segments delivered solid profits, with the US Card segment leading the way
Net Income After Tax * ($Millions)
Q104 Q403 Q103
US Card $ 386.8 $ 322.7 $ 308.1
Auto Finance $ 30.7 $ 34.4 $(6.5)
Global Financial Services $ 50.9 $ 3.3 $14.9
* Based on internal allocations of consolidated results.
First Quarter 2004 Results 14
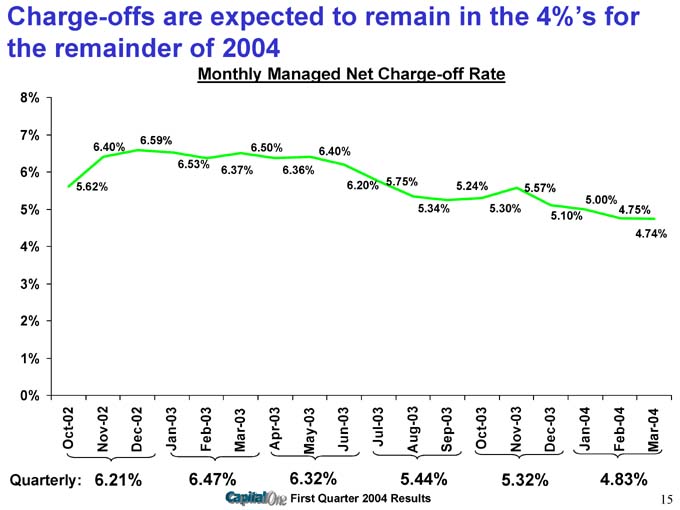
Charge-offs are expected to remain in the 4%’s for the remainder of 2004
Monthly Managed Net Charge-off Rate
8%
Quarterly: 6.21% 6.47% 6.32% 5.44% 5.32% 4.83%
First Quarter 2004 Results 15

Charge-offs improved across all segments in Q104
Managed Net Charge-off Rate by Segment
US Card
Auto
Global Financial Services
First Quarter 2004 Results 16
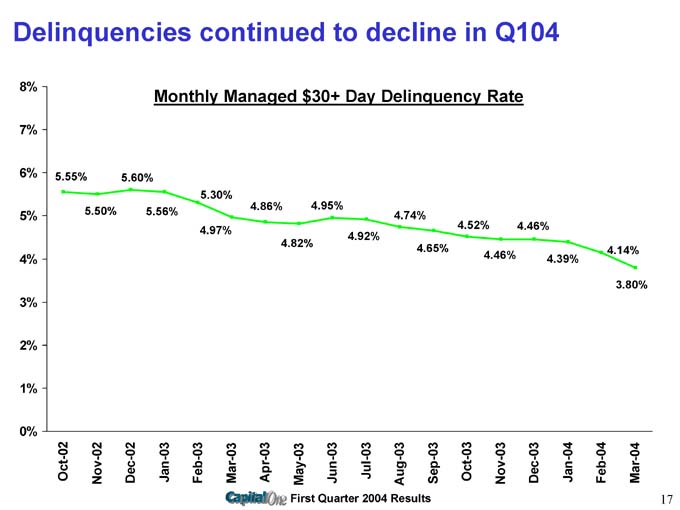
Delinquencies continued to decline in Q104
Monthly Managed $30+ Day Delinquency Rate
First Quarter 2004 Results 17
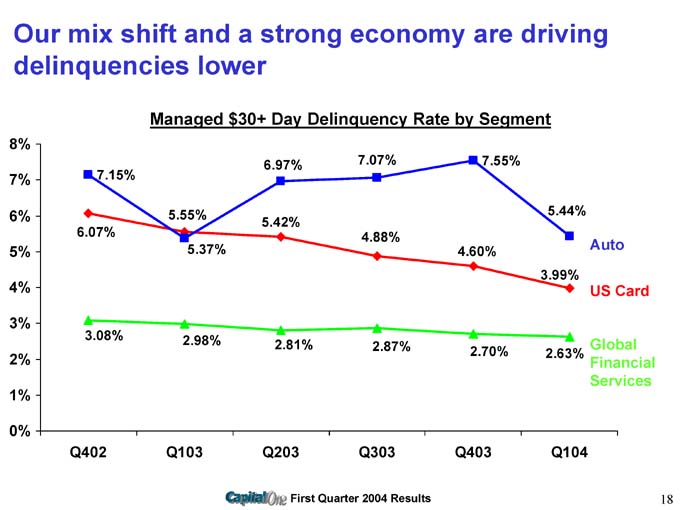
Our mix shift and a strong economy are driving delinquencies lower
Managed $30+ Day Delinquency Rate by Segment
Auto
US Card
Global Financial Services
First Quarter 2004 Results 18
We’re building Capital One for long-term success
Diversified Businesses
• Rigorous, conservative underwriting
• Multiple products
• Multiple geographies
Strong Balance Sheet
• Multiple funding sources
• Strong liquidity and capital
• Hedged against rising interest rates
Stable, Profitable, Diversified Consumer Financial Services Company
First Quarter 2004 Results 19